Description
gplt is a very convenient python tool for plotting gromacs output file, such as .xvg, .xpm or convert .dat to .xpm for visualization. This tool is similar to DuIvyTools, and these features could potentially be part of DuIvyTools. However, if time permits, I hope that it can become more powerful than DuIvyTools in the future.
Install
Requirements
Python >= 3.8numpypandasandopenpyxl
Install
The module is installed by
pipmethod:pip install numpy matplotlib colorama pandas openpyxl pip install gplt -i https://test.pypi.org/simple
Please ALWAYS install Latest version.
Update this module if you have installed:
pip install gplt --upgrade -i https://test.pypi.org/simple
Usage
General options
gplt -h
usage: gplt [-h] [-f [FILE [FILE ...]]] [-o OUTFILE] [-title TITLE]
            [-legend [LEGEND [LEGEND ...]]] [-xlim XLIM XLIM] [-ylim YLIM YLIM] [-xprec XPREC]
            [-yprec YPREC] [-zprec ZPREC] [-xaxis XAXIS] [-yaxis YAXIS] [-ux UNITX] [-uy UNITY]
            [-sx SCALEX] [-sy SCALEY] [-sz SCALEZ] [-style MPLSTYLE] [-u USING]

A program for plotting gromacs data

optional arguments:
  -h, --help            show this help message and exit

Options to specify input files:
  -f [FILE [FILE ...]], --file [FILE [FILE ...]]
                        A gromacs data files, such as xvg, xpm, dat

Options to specify output files::
  -o OUTFILE, --outfile OUTFILE
                        Save figure to file, such as png, jpg with 600 dpi, or pdf. Save data to
                        excel xlsx for xvg

Other options::
  -title TITLE, --title TITLE
                        Set title of figure
  -legend [LEGEND [LEGEND ...]], --legend [LEGEND [LEGEND ...]]
                        Set legends of figure
  -xlim XLIM XLIM, --xlim XLIM XLIM
                        Set limits of xaxis
  -ylim YLIM YLIM, --ylim YLIM YLIM
                        Set limits of yaxis
  -xprec XPREC, --xprec XPREC
                        Set the precision of xtick
  -yprec YPREC, --yprec YPREC
                        Set the precision of ytick
  -zprec ZPREC, --zprec ZPREC
                        Set the precision of ztick if available
  -xaxis XAXIS, --xaxis XAXIS
                        Set X axis label
  -yaxis YAXIS, --yaxis YAXIS
                        Set y axis label
  -ux UNITX, --unitx UNITX
                        The unit for x axis, auto convert if avaliable
  -uy UNITY, --unity UNITY
                        The unit for y axis, auto convert if avaliable
  -sx SCALEX, --scalex SCALEX
                        The scale fractor for x axis
  -sy SCALEY, --scaley SCALEY
                        The scale fractor for y axis
  -sz SCALEZ, --scalez SCALEZ
                        The scale fractor for z axis
  -style MPLSTYLE, --mplstyle MPLSTYLE
                        The matplotlib style file for plotting
  -u USING, --using USING
                        Use the selection columns to plot. 1-3 represents 1,2,3 column, 1,2
                        represent 1 and 2 column. 1,2:2 represents 1 and 2 column for file 1, 2
                        column for file2, ...(: represents multi-files)
Plot xvg
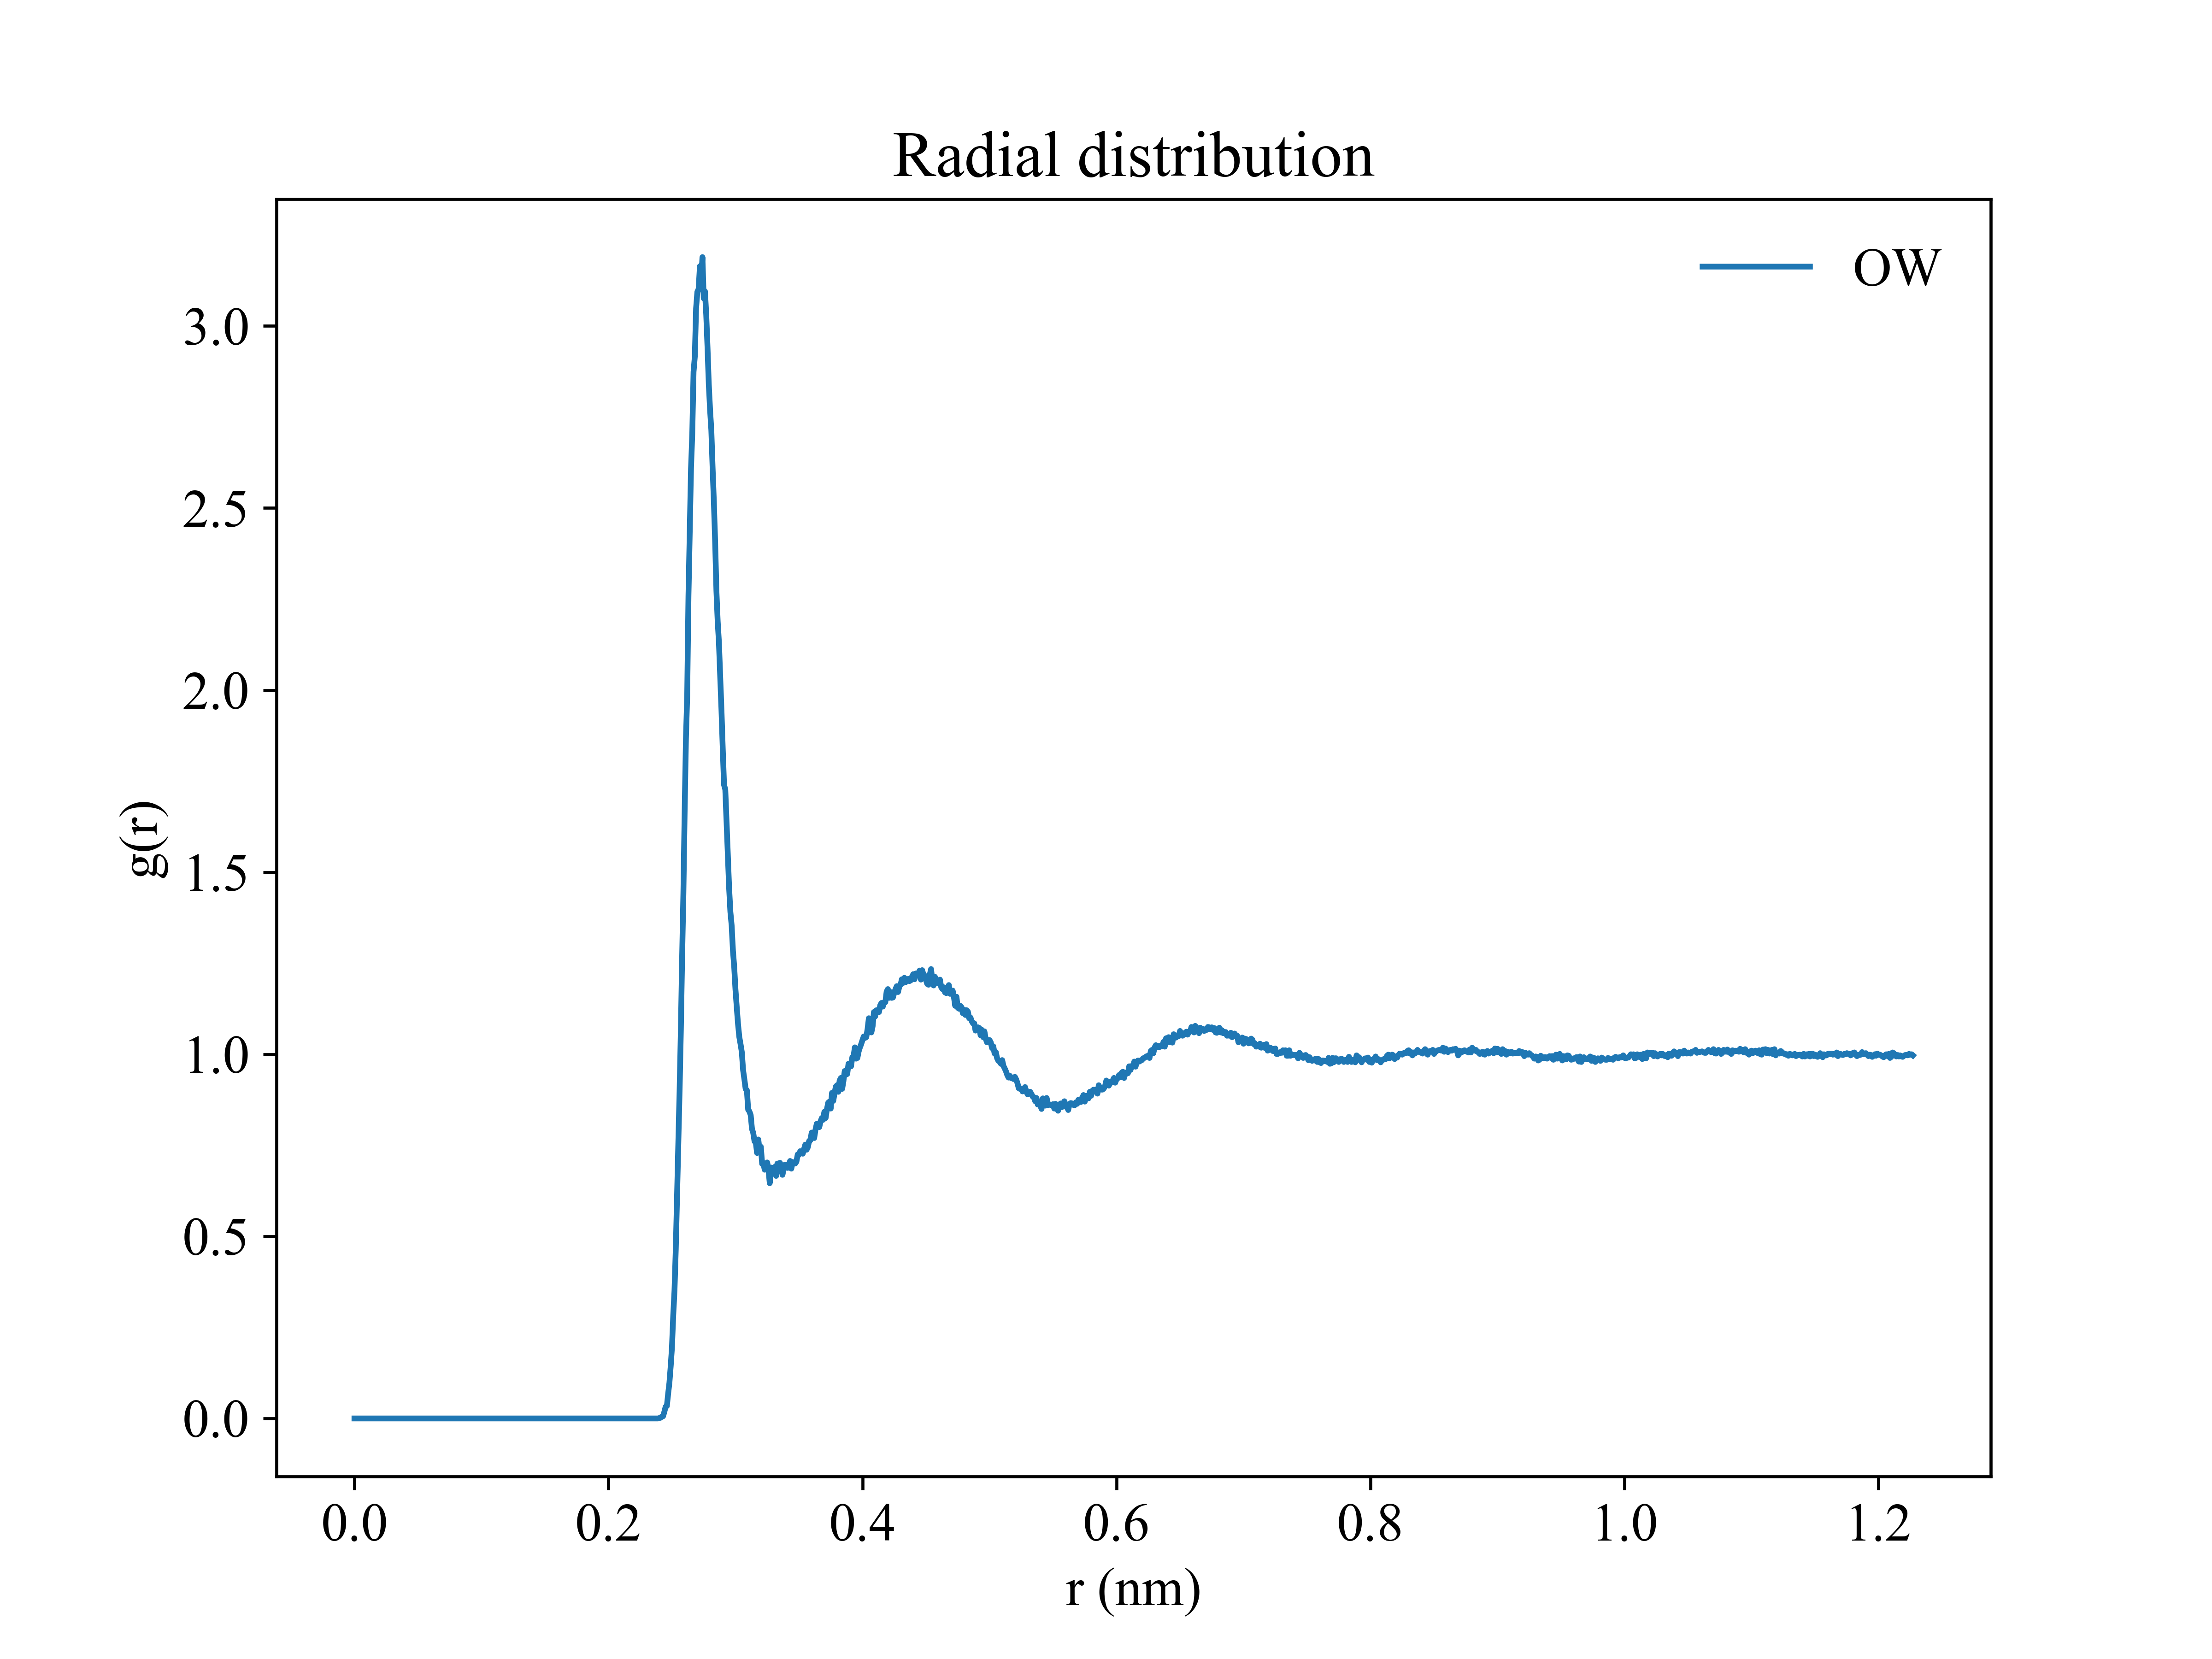
gplt -f rdf.xvg
gplt -f rdf.xvg -ux angstrom

Plot xpm
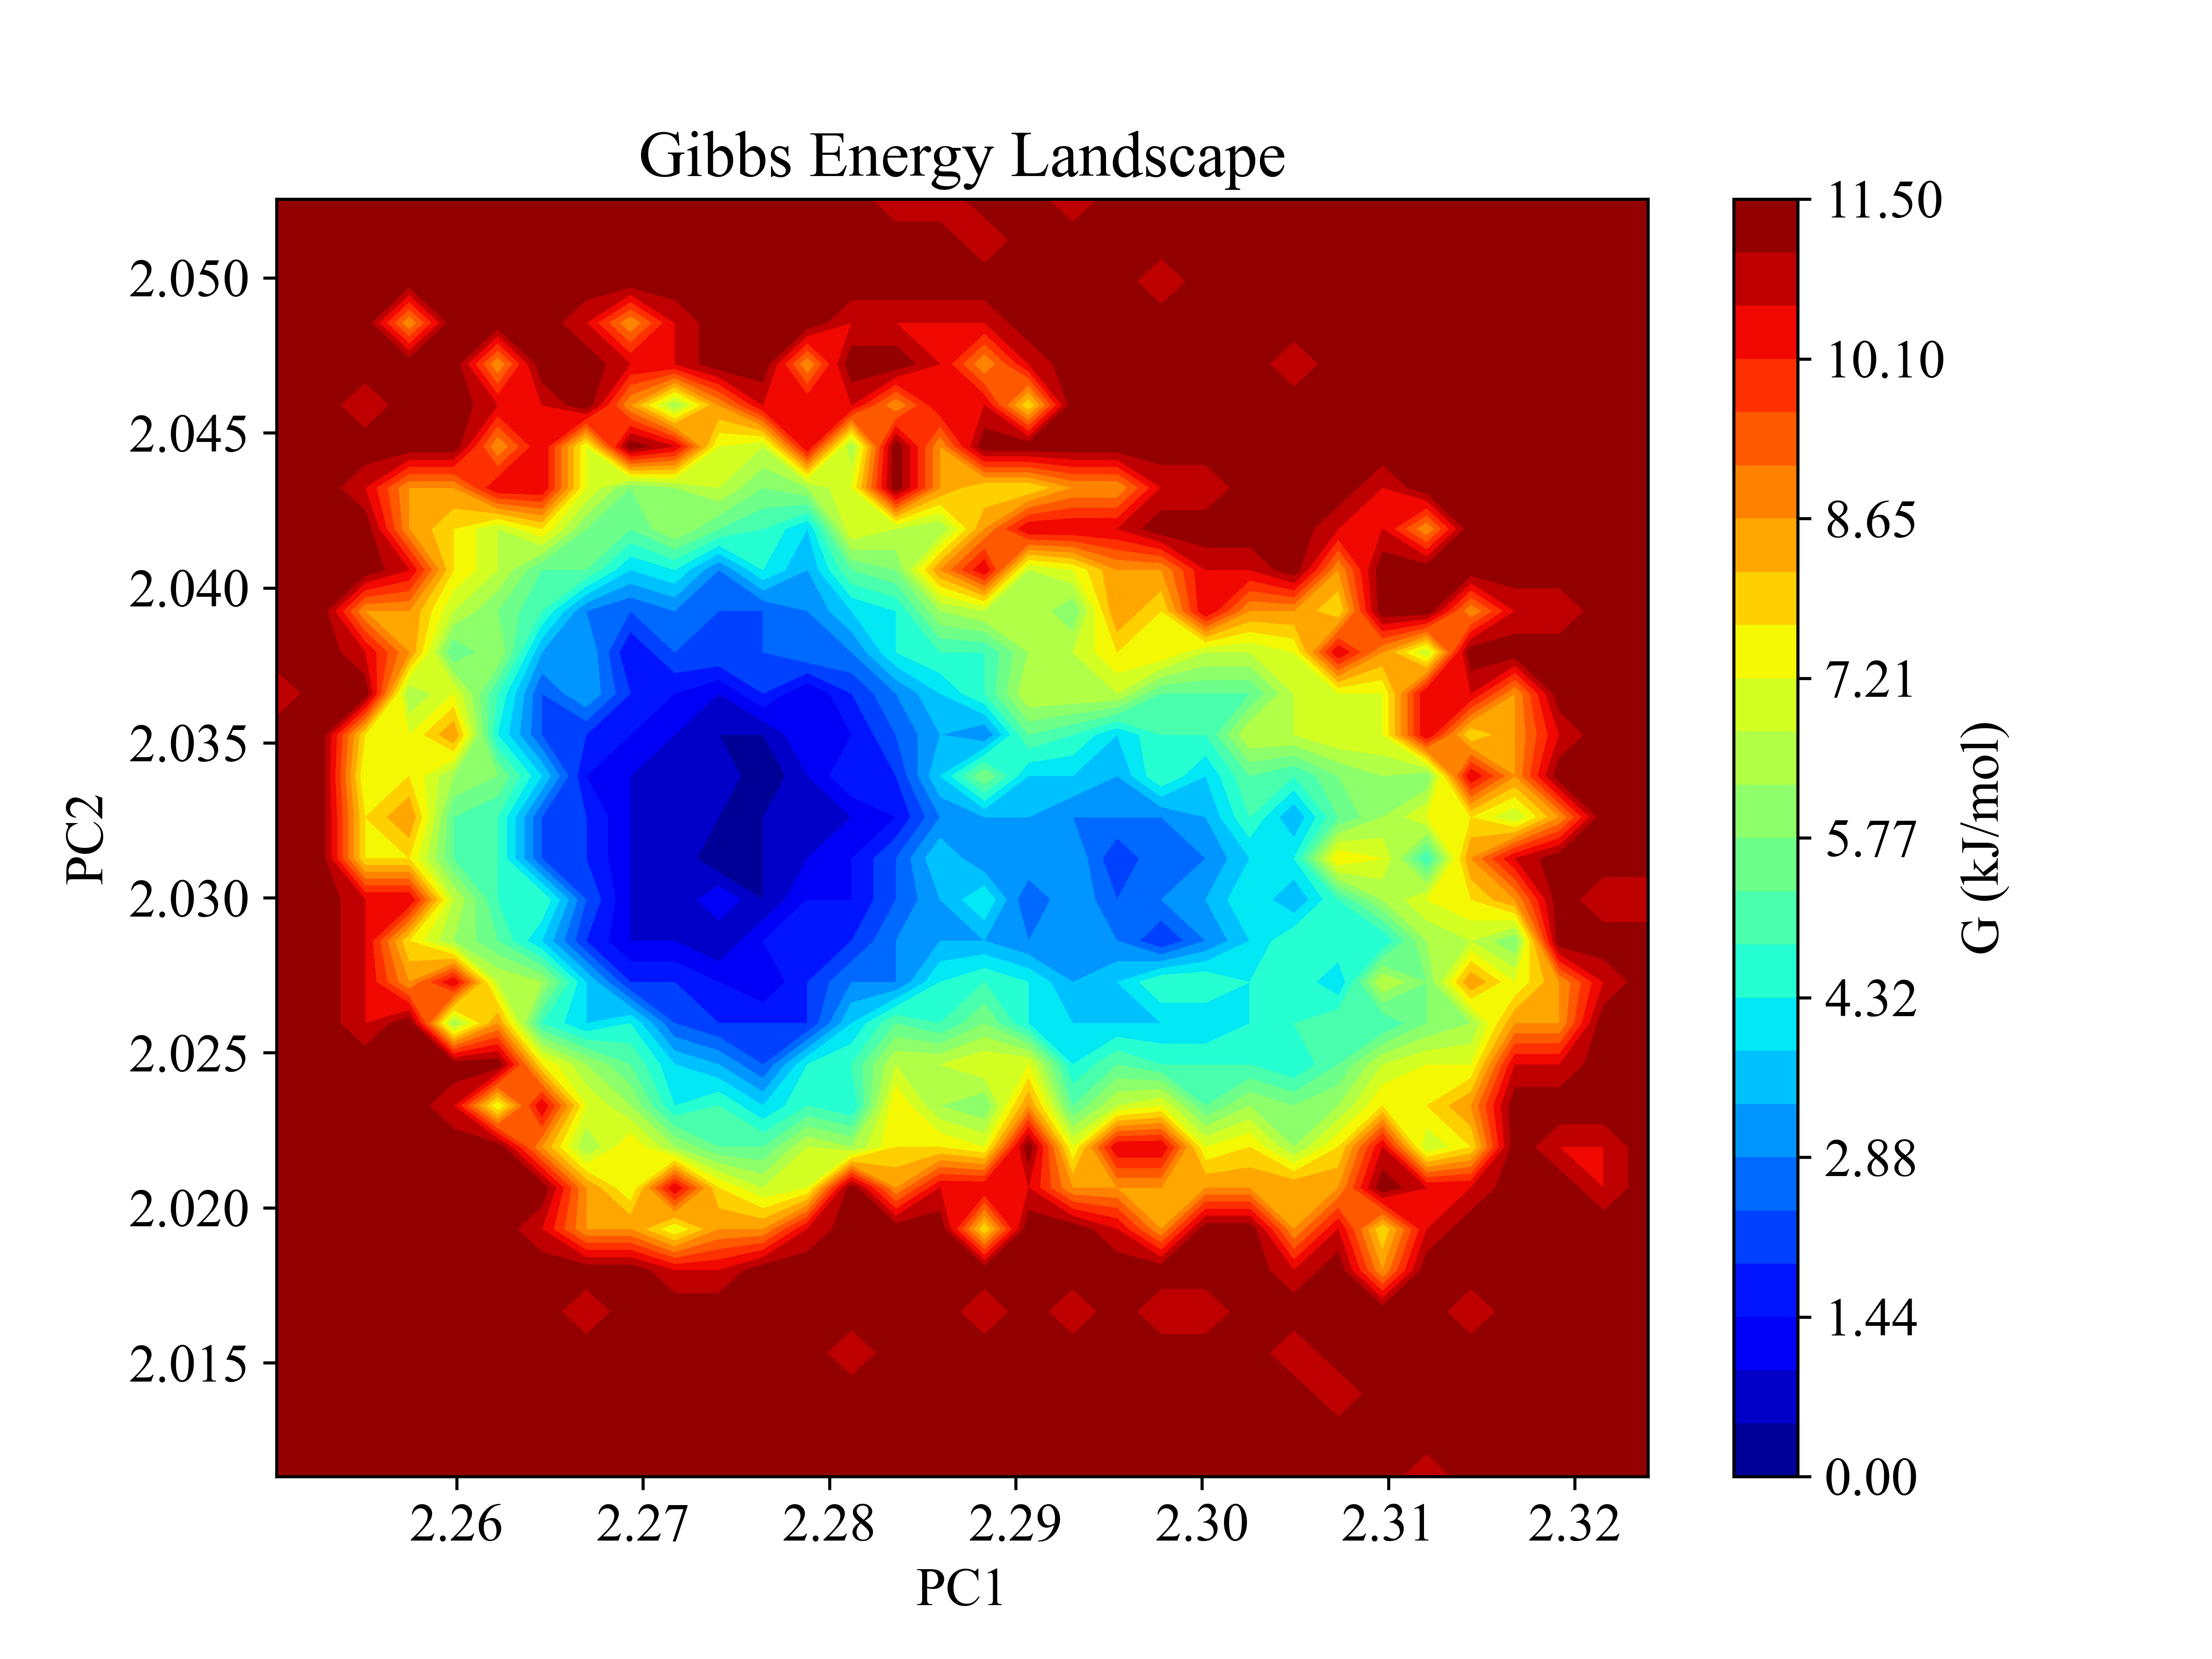
gplt -f gibbs.xpm
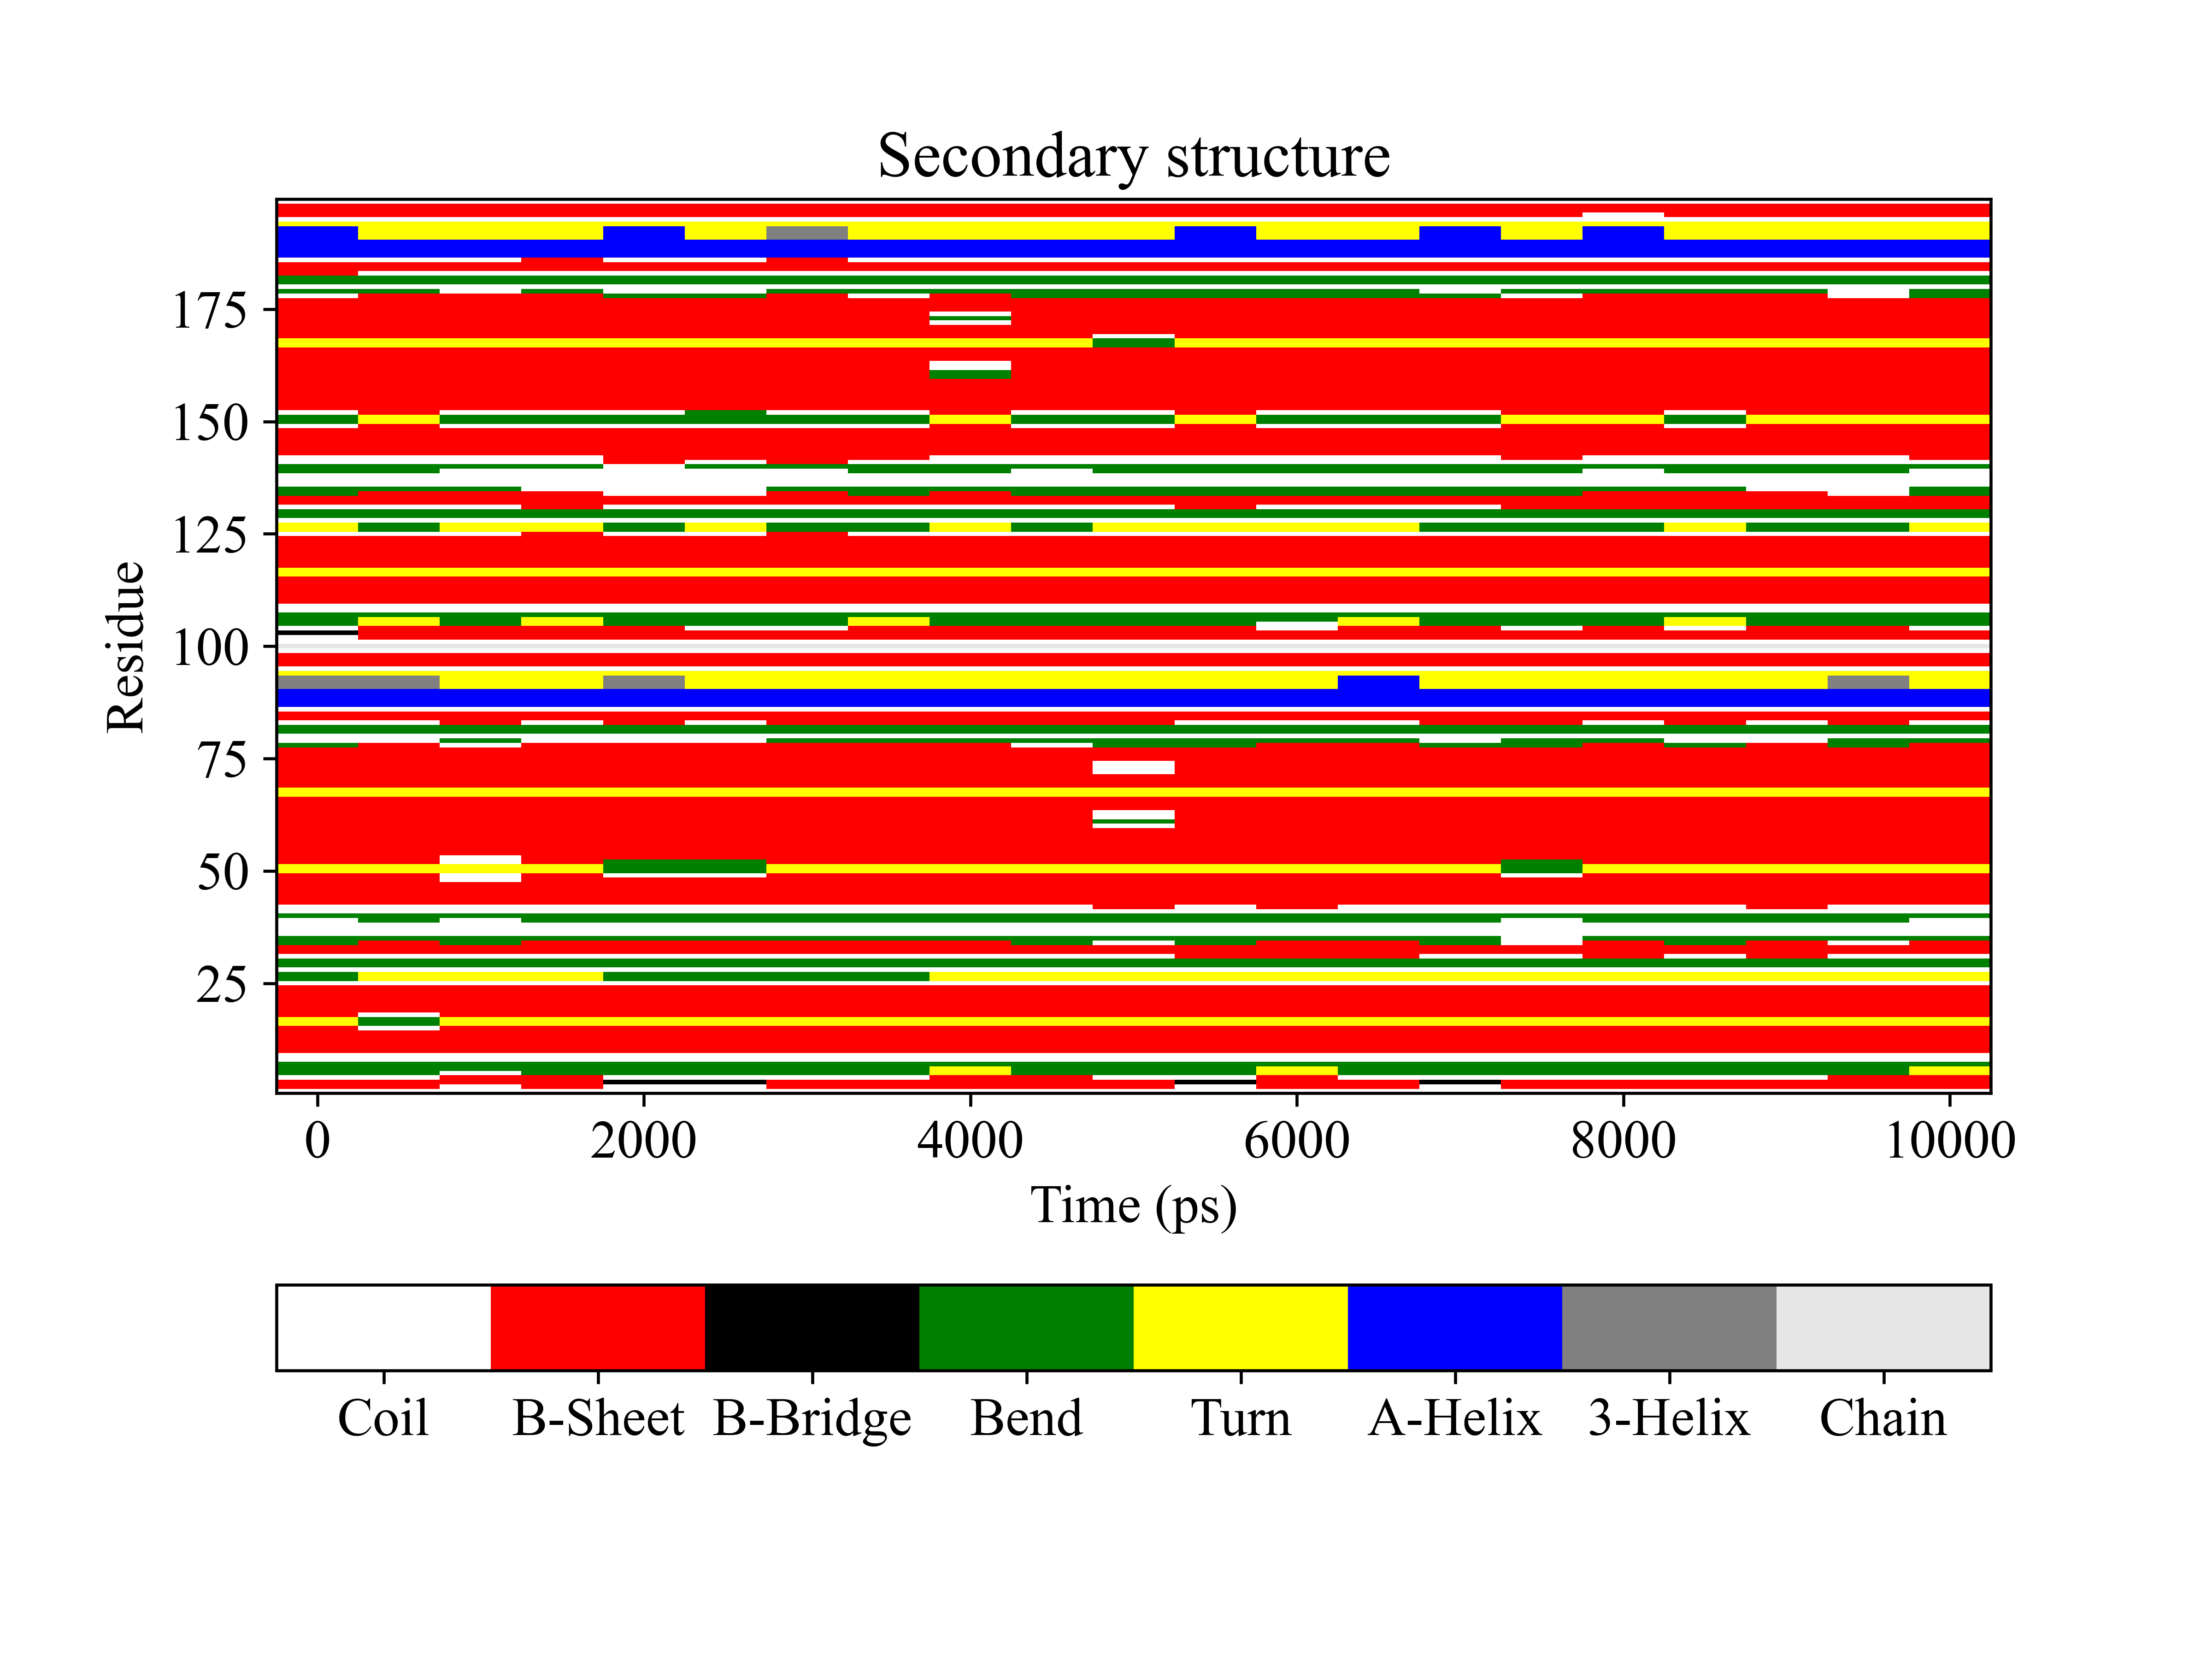
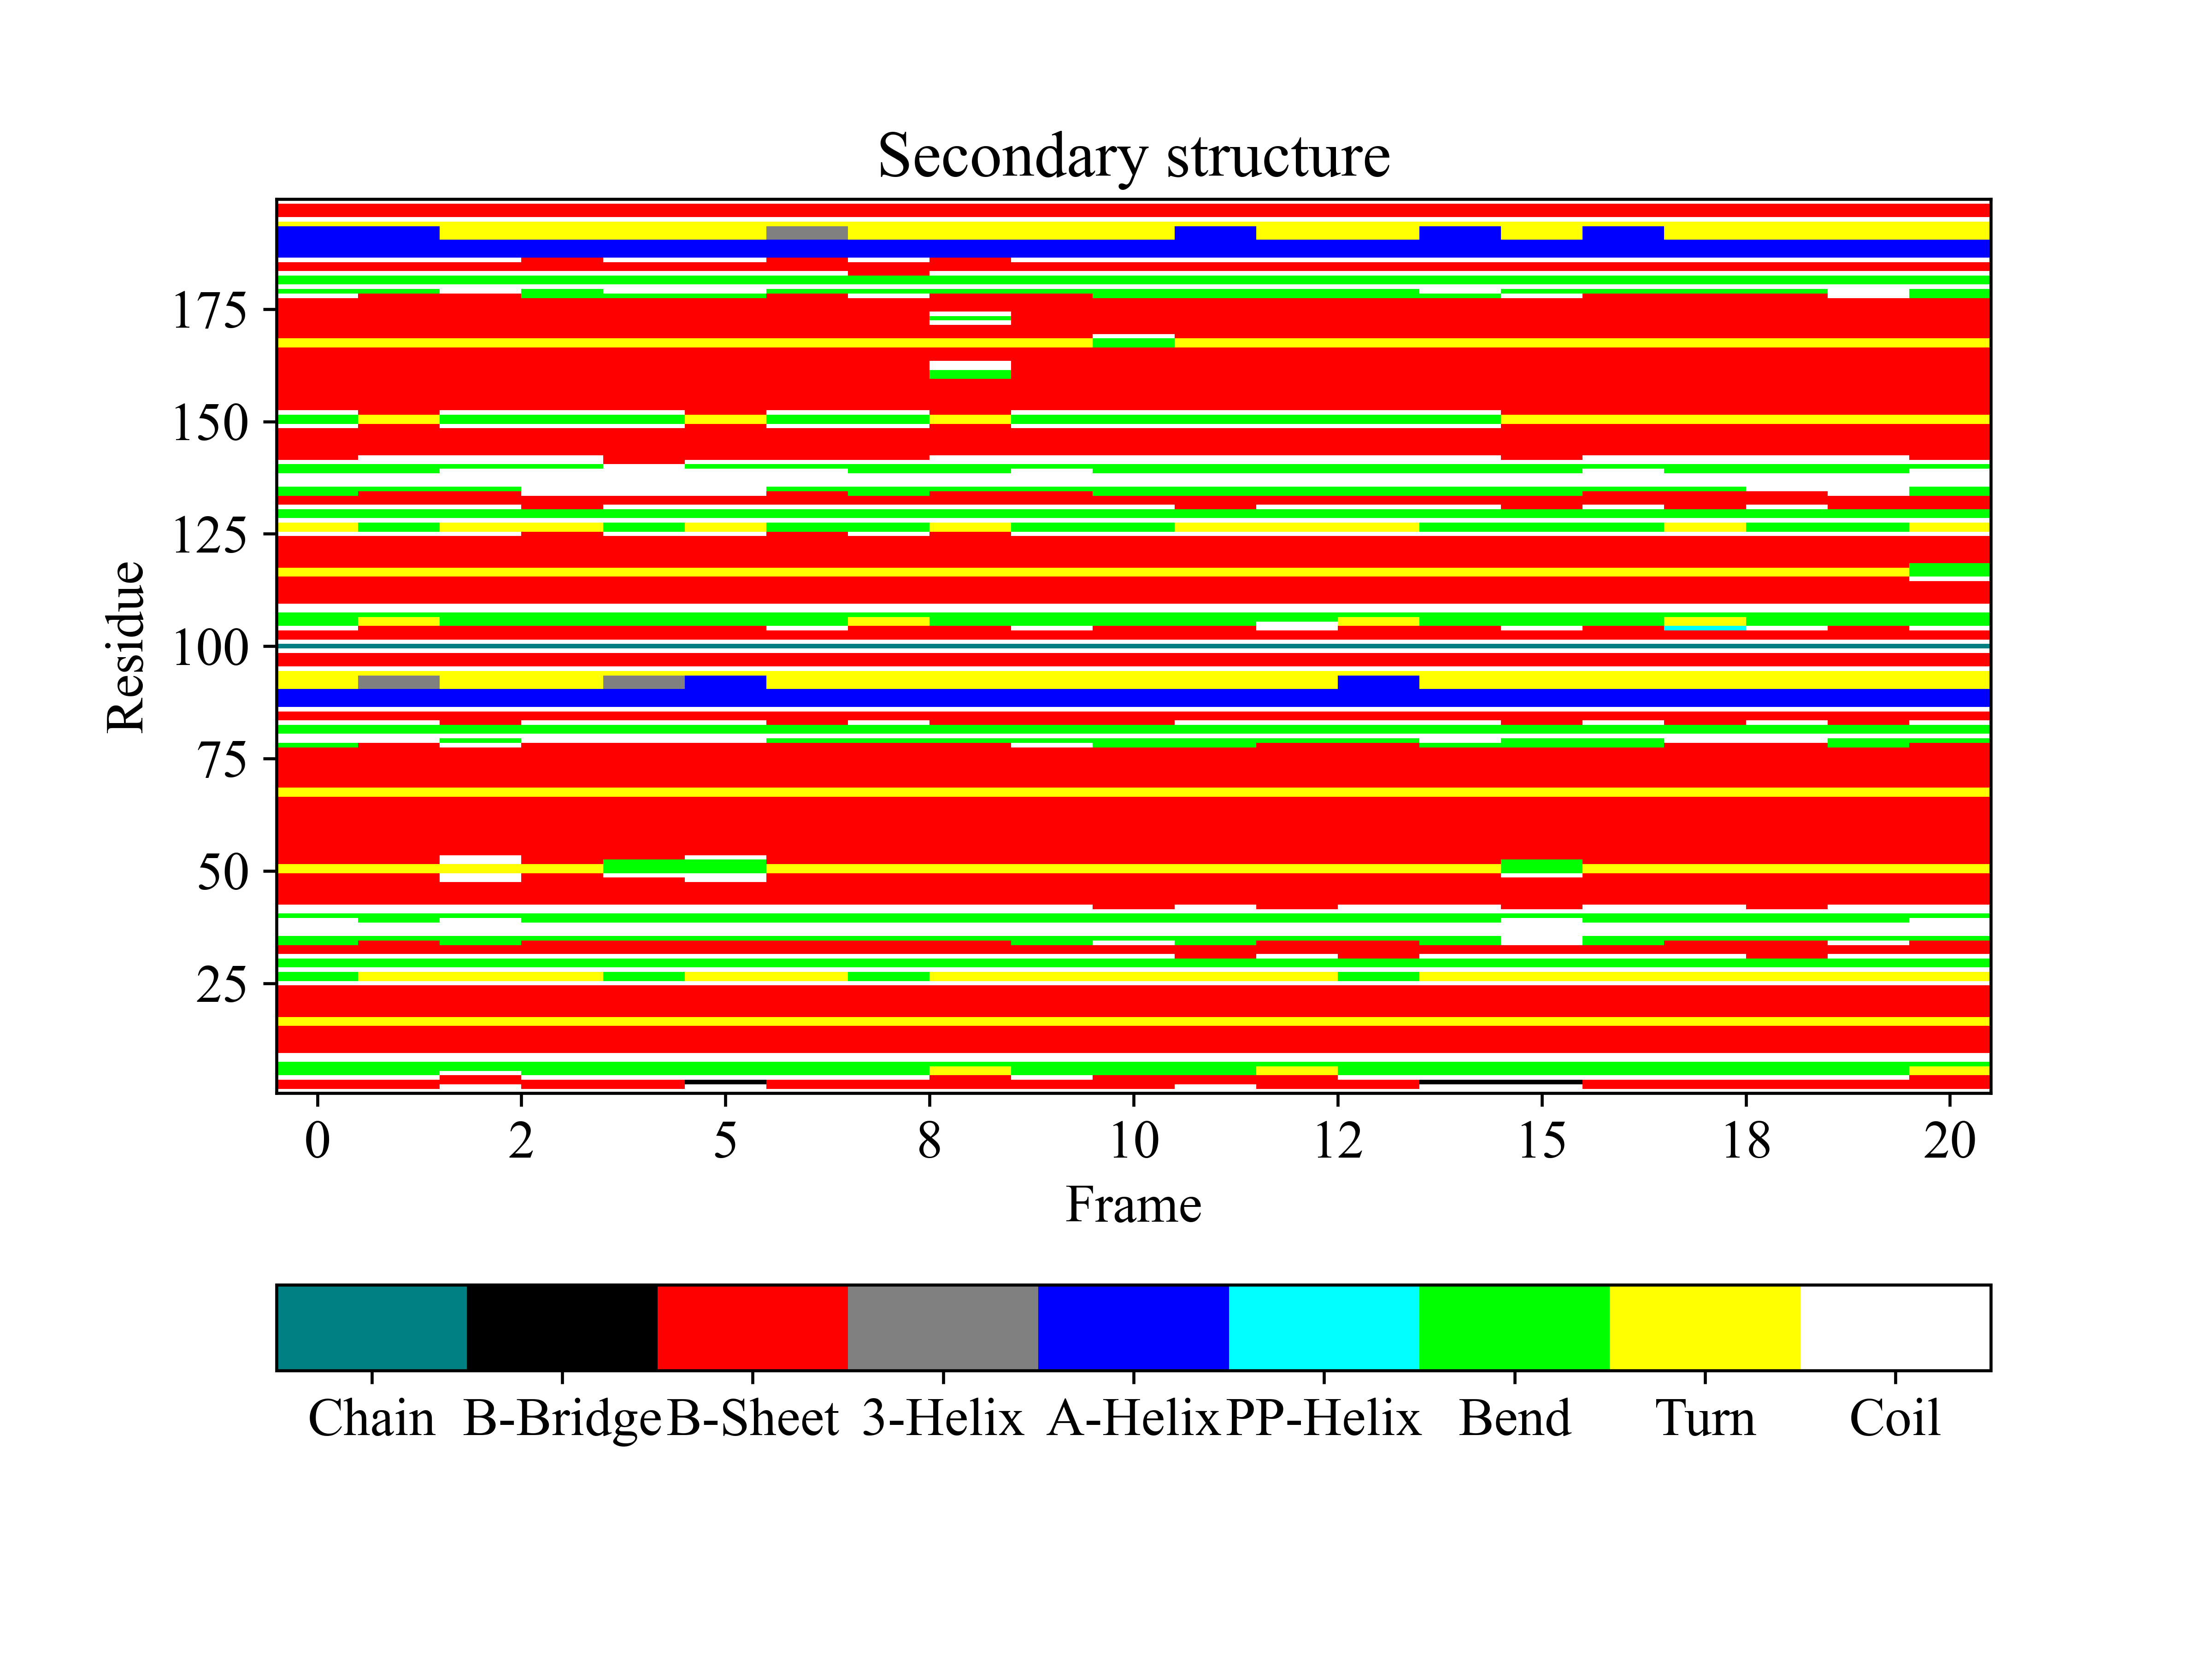
gplt -f ss.xpm
Convert dat to xpm
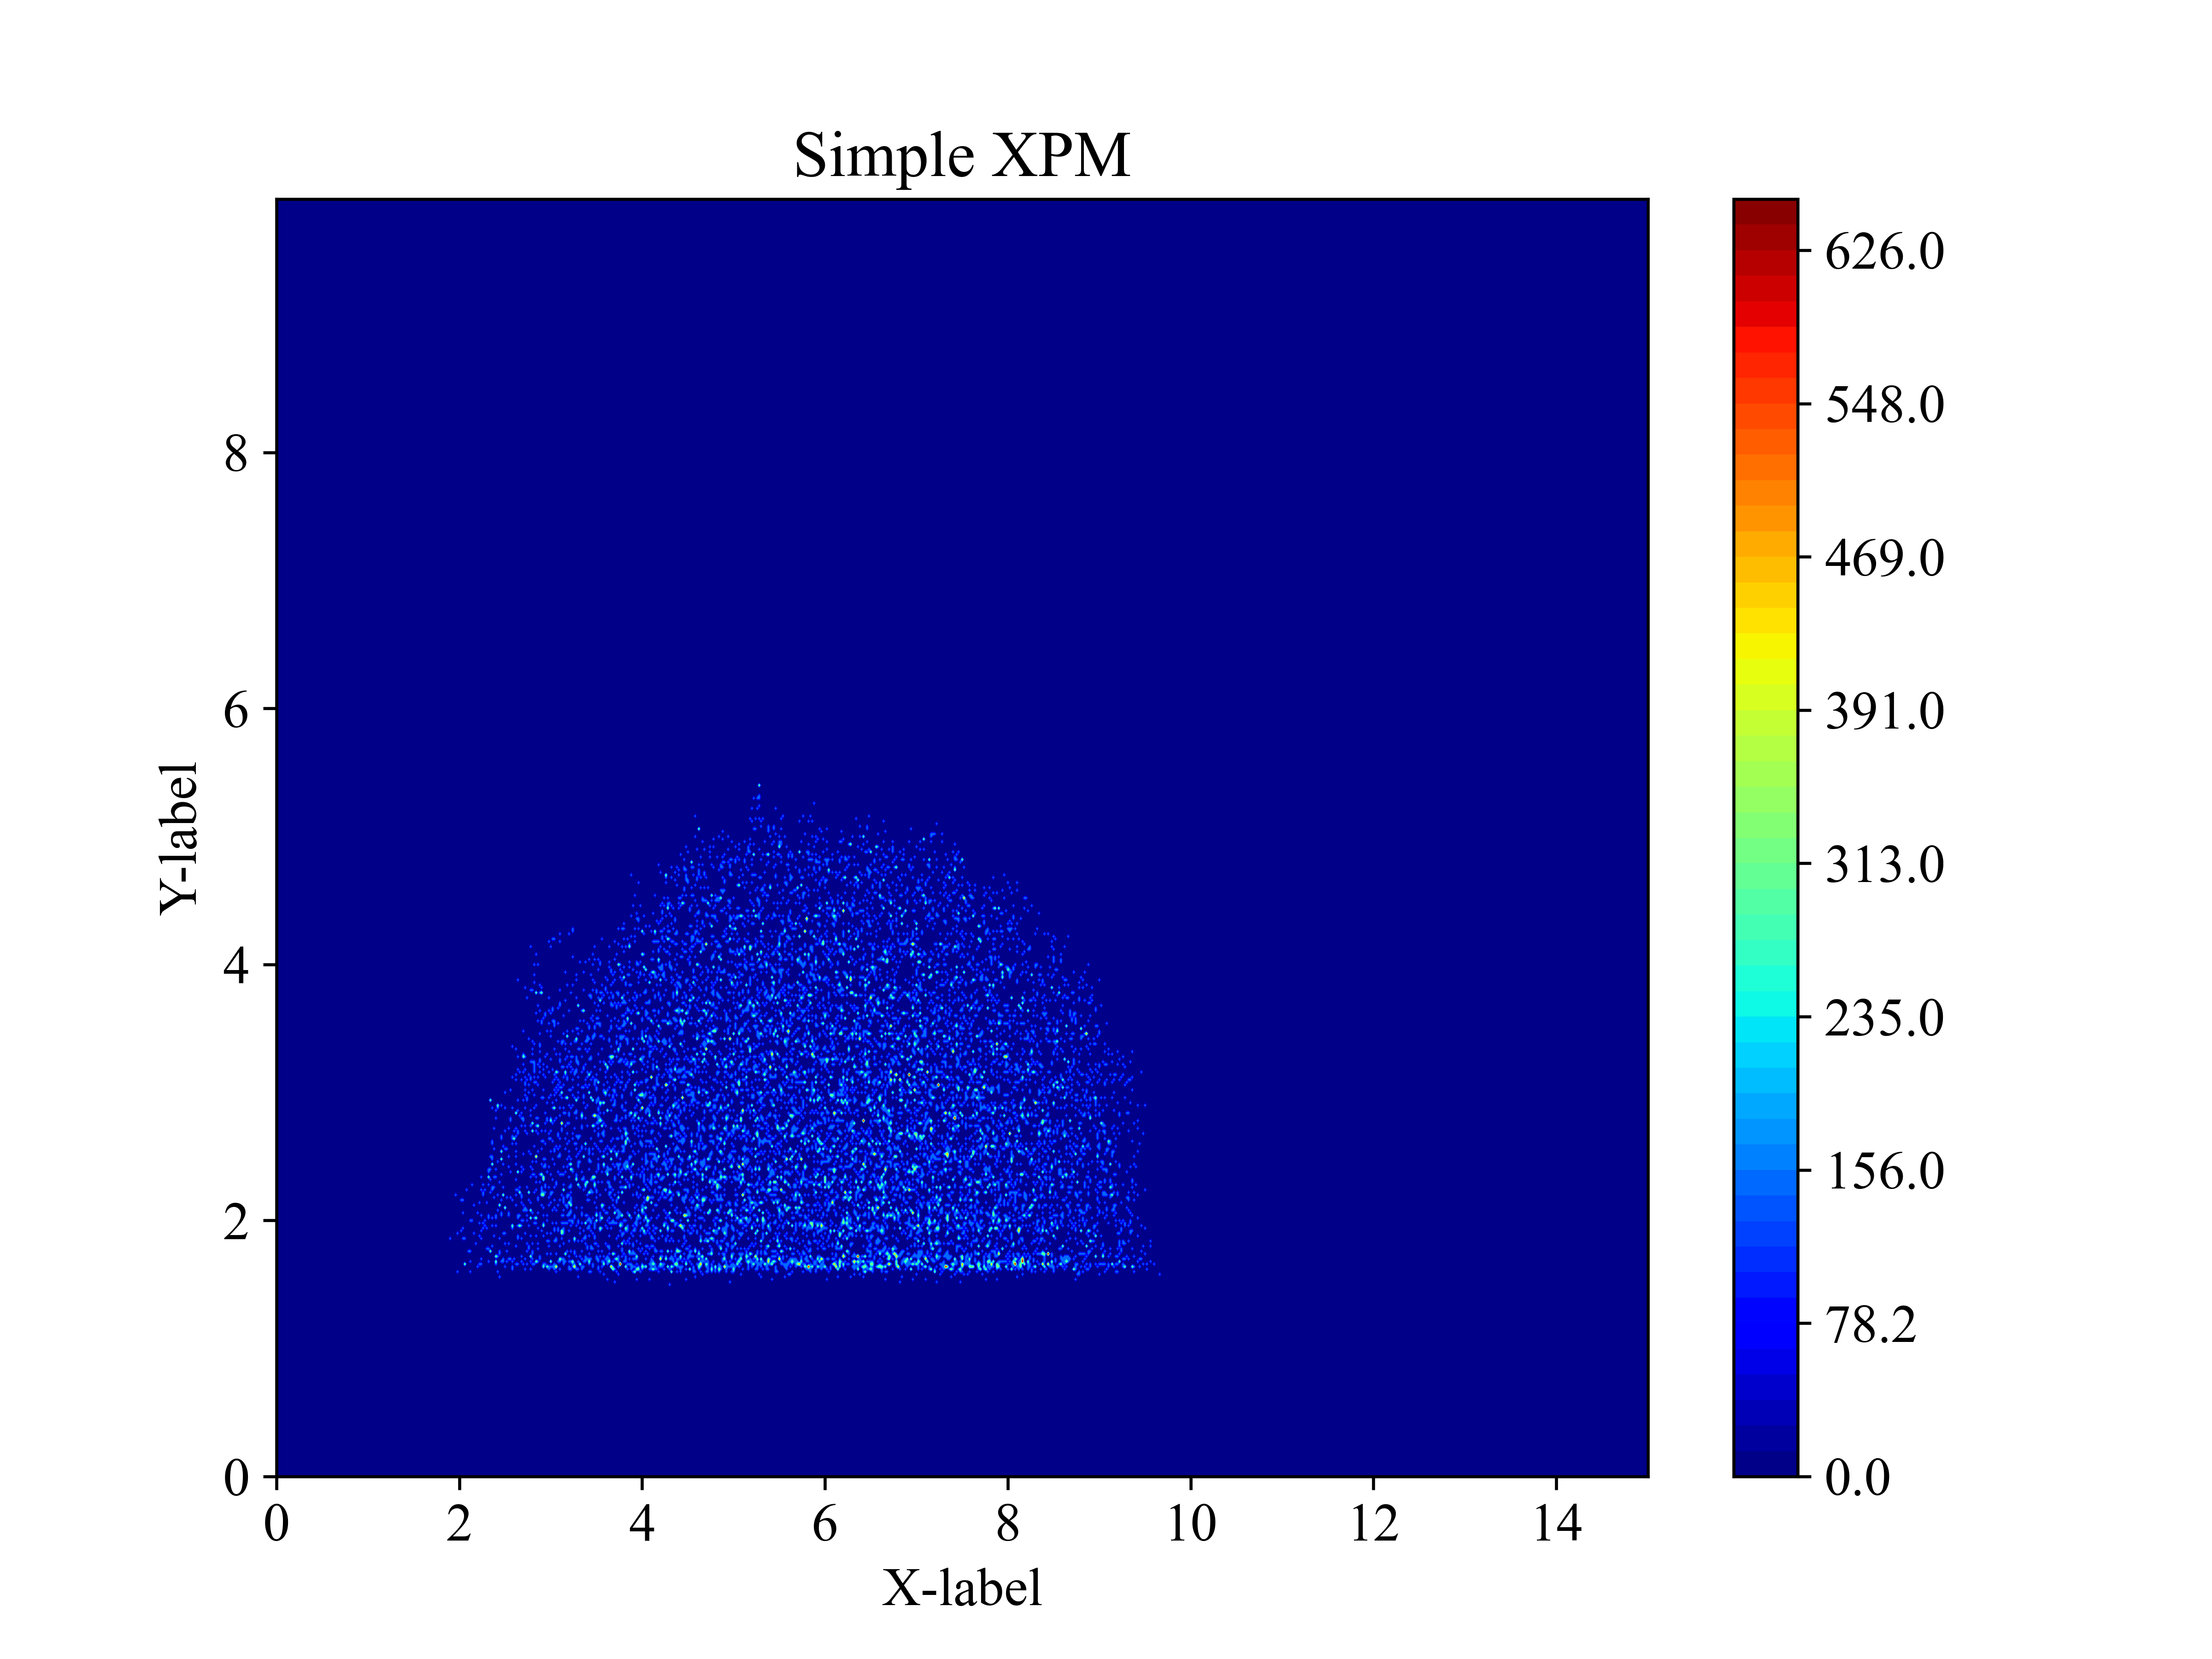
dat from gmx tool, such as gmx densmap -od
The .dat file was generated by gromacs tool, such as densmap.dat, dssp.dat (gmx dssp)
gplt -f densmap.dat && gplt -f densmap.xpm
This command will generate a xxx.xpm file, then you can plot it by gplt -f densmap.xpm
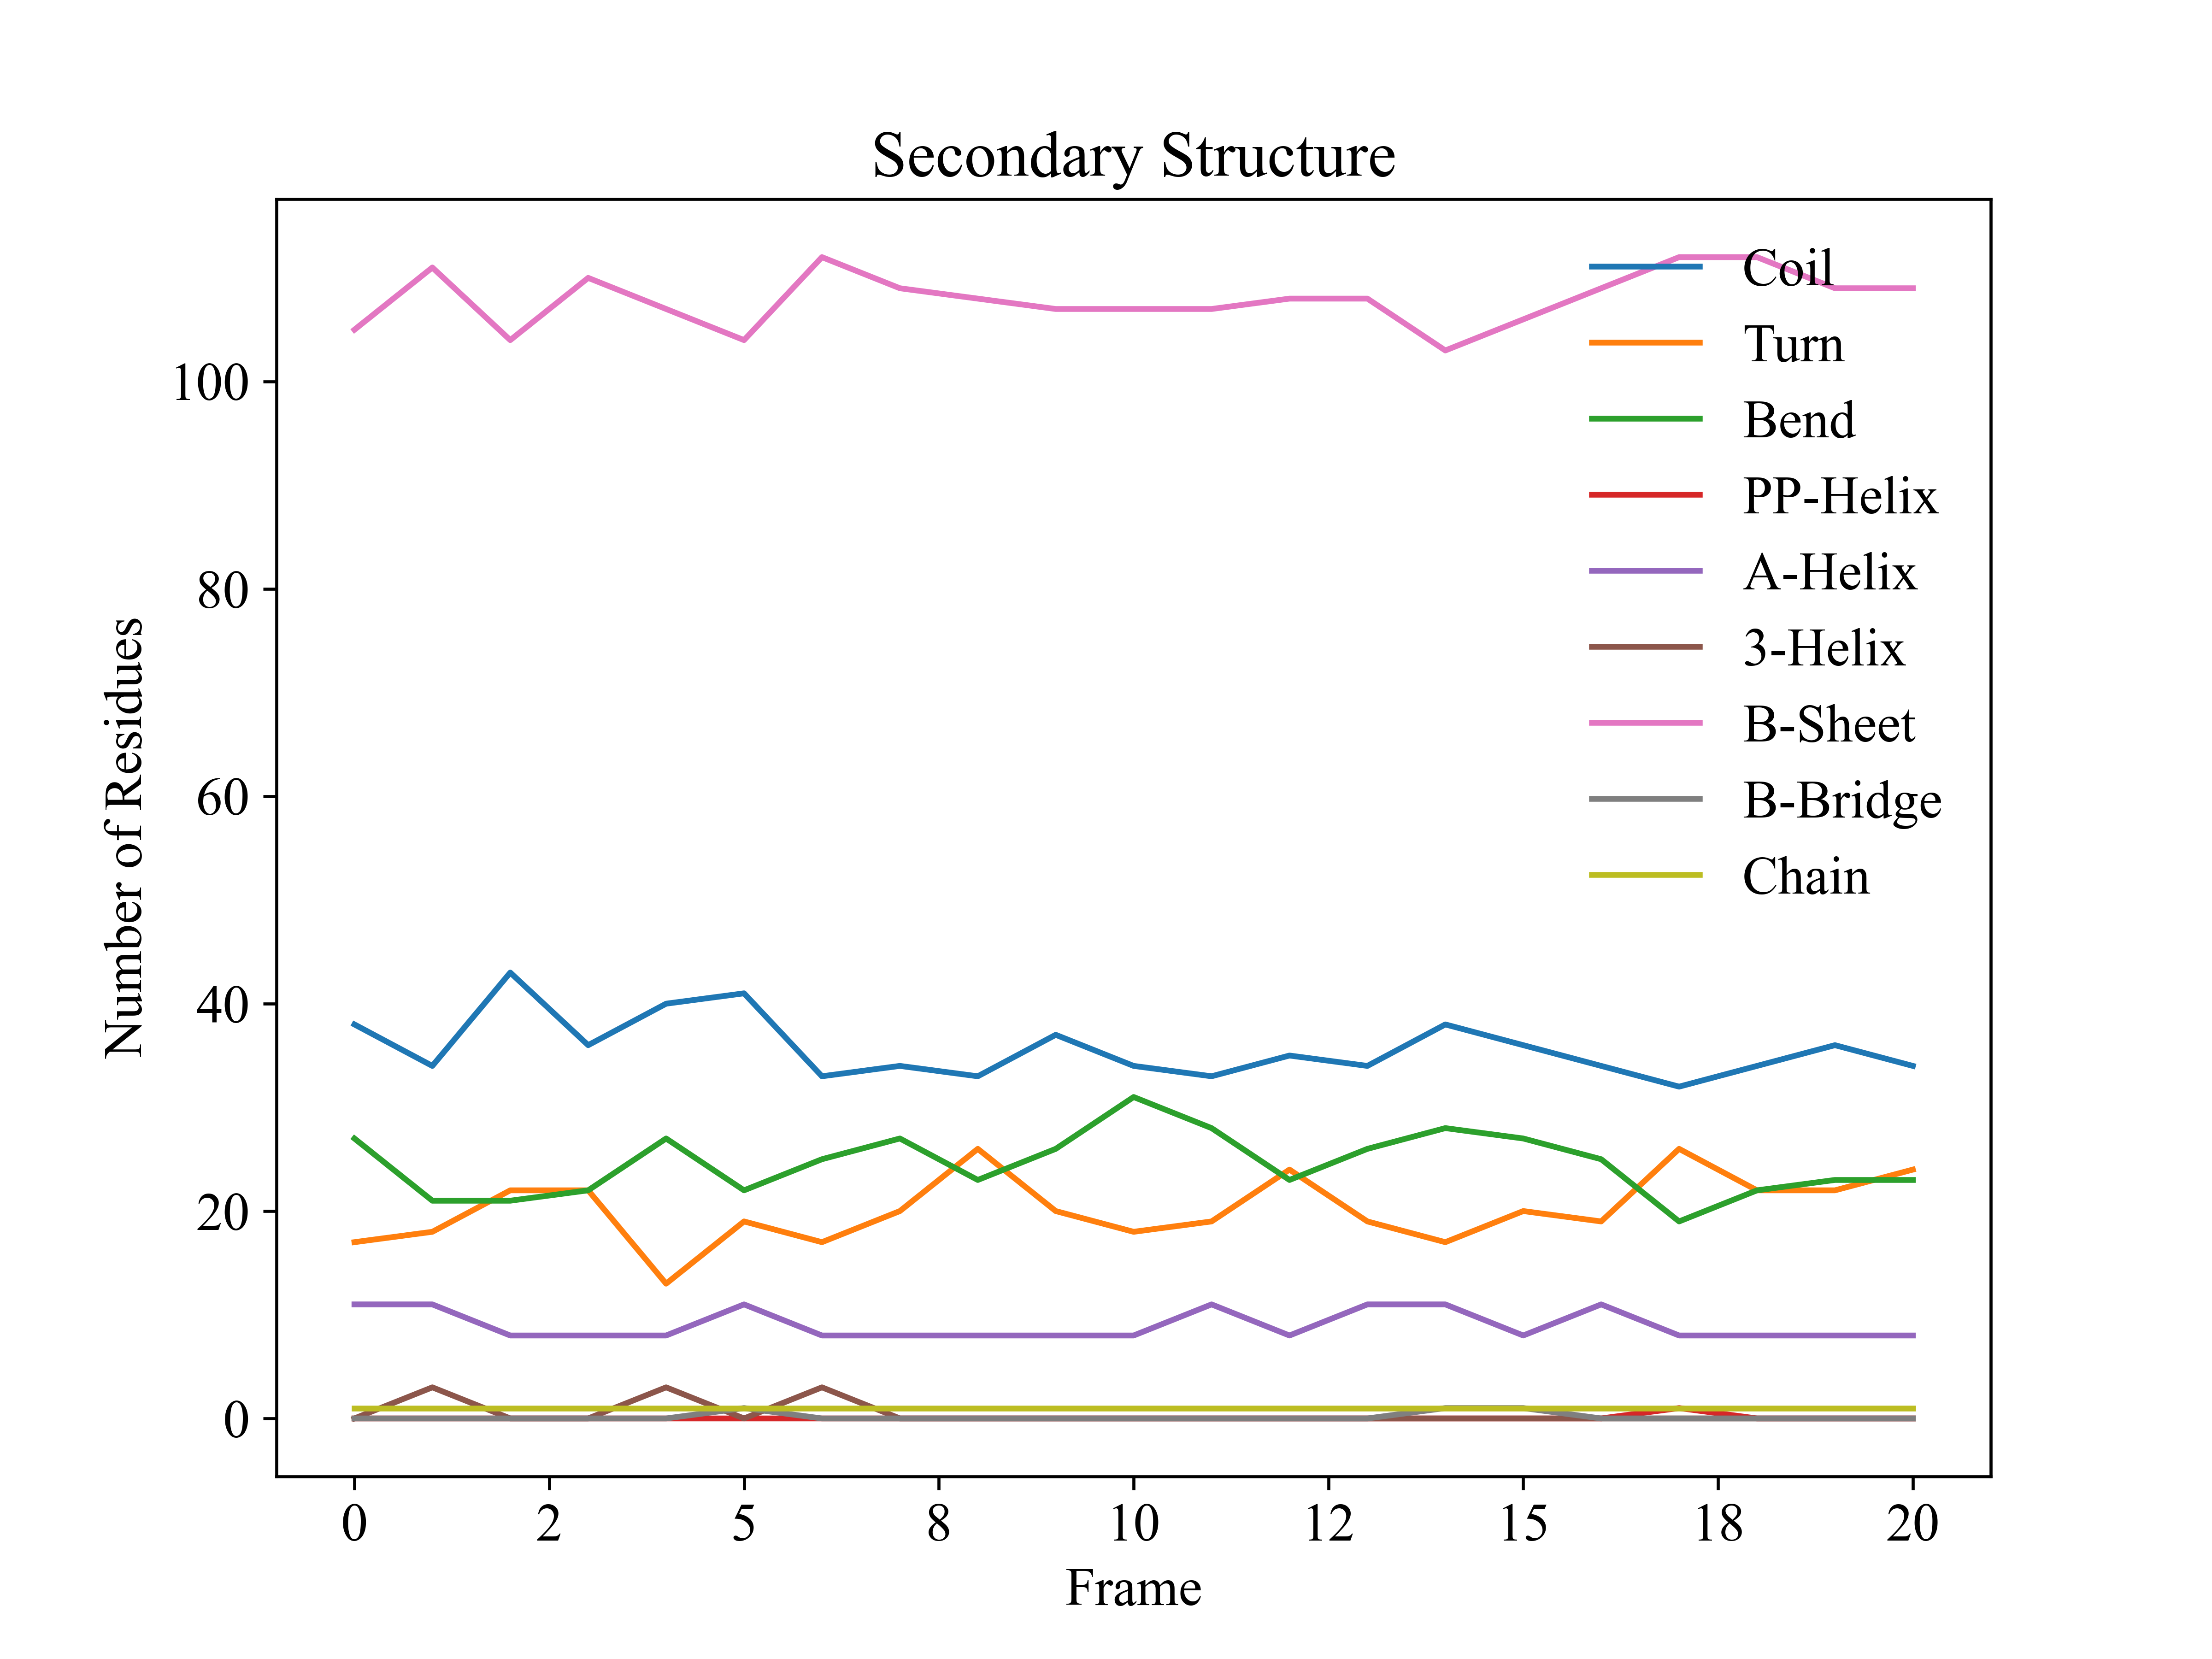
dssp.dat for gmx dssp [gmx >= 2023]
gplt -f dssp.dat && gplt -f dssp.xpm -xprec 0 -yprec 0 -o dssp.png && gplt -f scount.xvg -xprec 0 -yprec 0 -o scount.png
Cite
If gplt is utilized in your work, please cite as follows in main text:
Yujie Liu, gplt (v0.1.12). Zenodo. https://doi.org/10.5281/zenodo.13208831