Description
gplt is a very convenient python tool for plotting gromacs output file, such as .xvg, .xpm or convert .dat to .xpm for visualization. This tool is similar to DuIvyTools, and these features could potentially be part of DuIvyTools. However, if time permits, I hope that it can become more powerful than DuIvyTools in the future.
Cite
Attention
If gplt is utilized in your work, please MUST cite as follows in main text:
Yujie Liu, gplt. Zenodo. https://doi.org/10.5281/zenodo.13208831
Installation
Requirements
Python >= 3.8numpy,matplotlib,openpyxl, etc.
Install
The module is installed by
pipmethod:pip install numpy matplotlib colorama pandas openpyxl pip install gplt -i https://test.pypi.org/simple
Please ALWAYS install Latest version.
Update this module if you have installed:
pip install gplt --upgrade -i https://test.pypi.org/simple
Usage
General options
Use -h to show available options:
gplt -h
Plot xvg
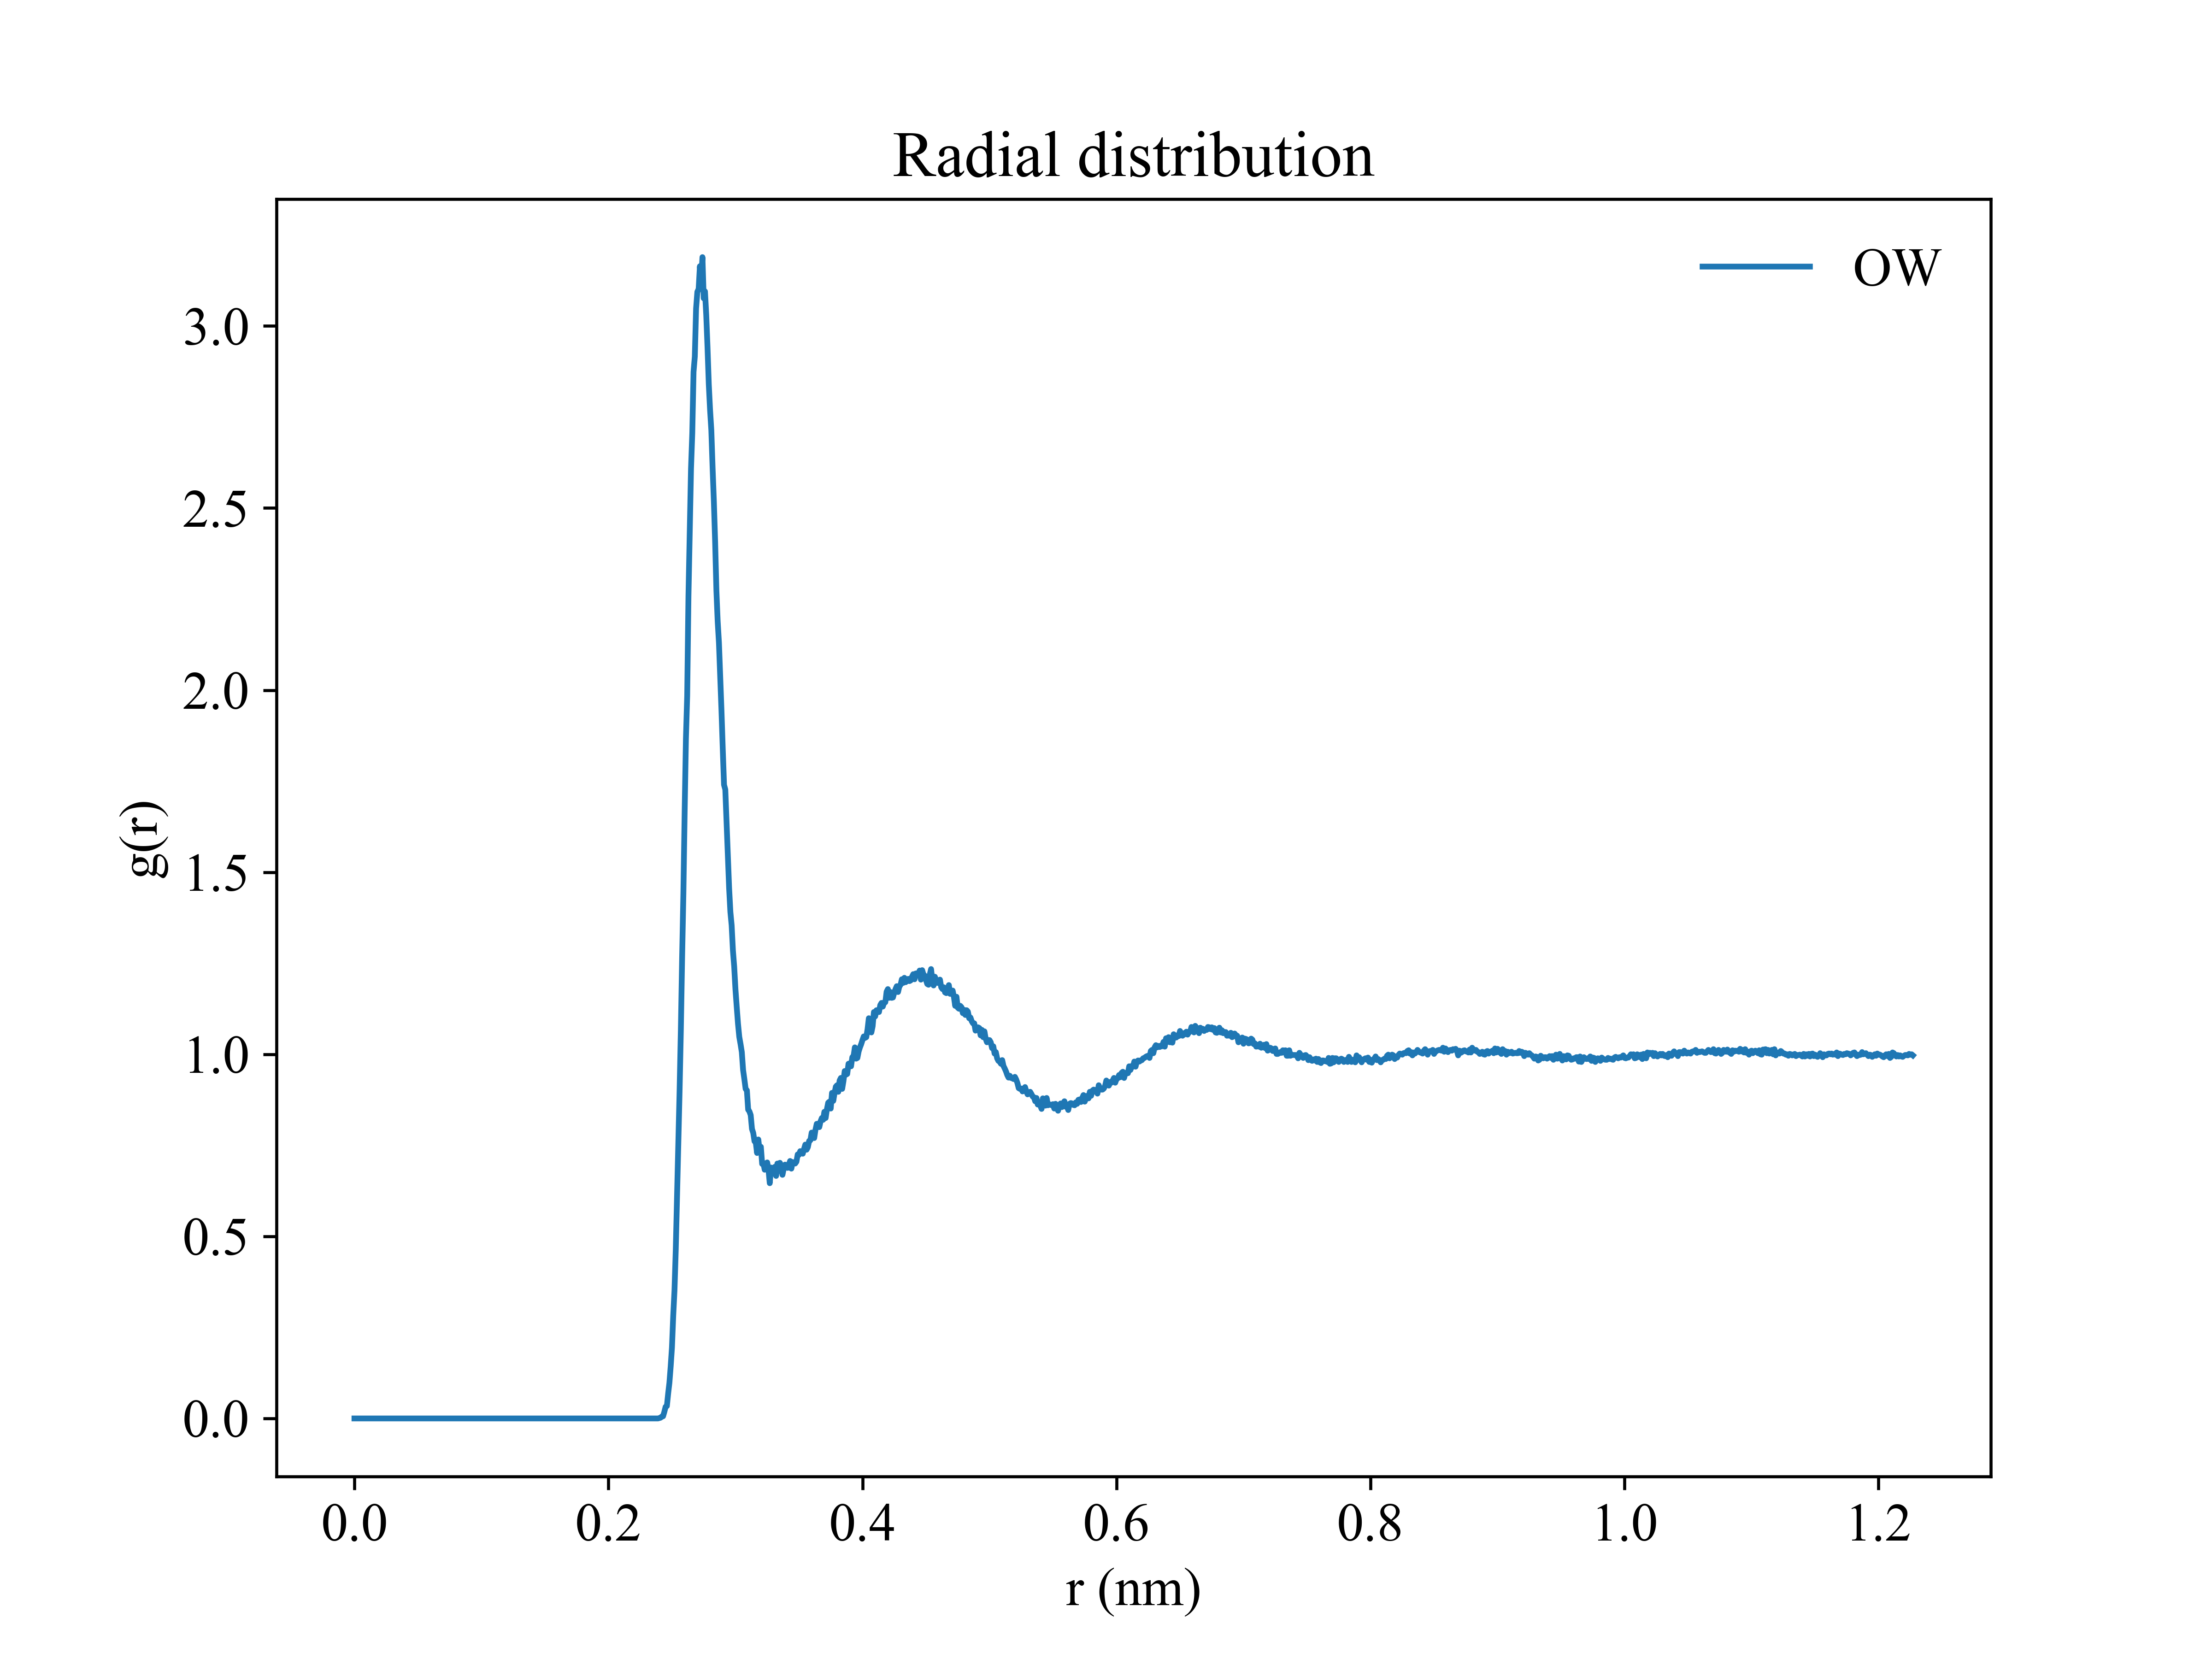
gplt -f rdf.xvg
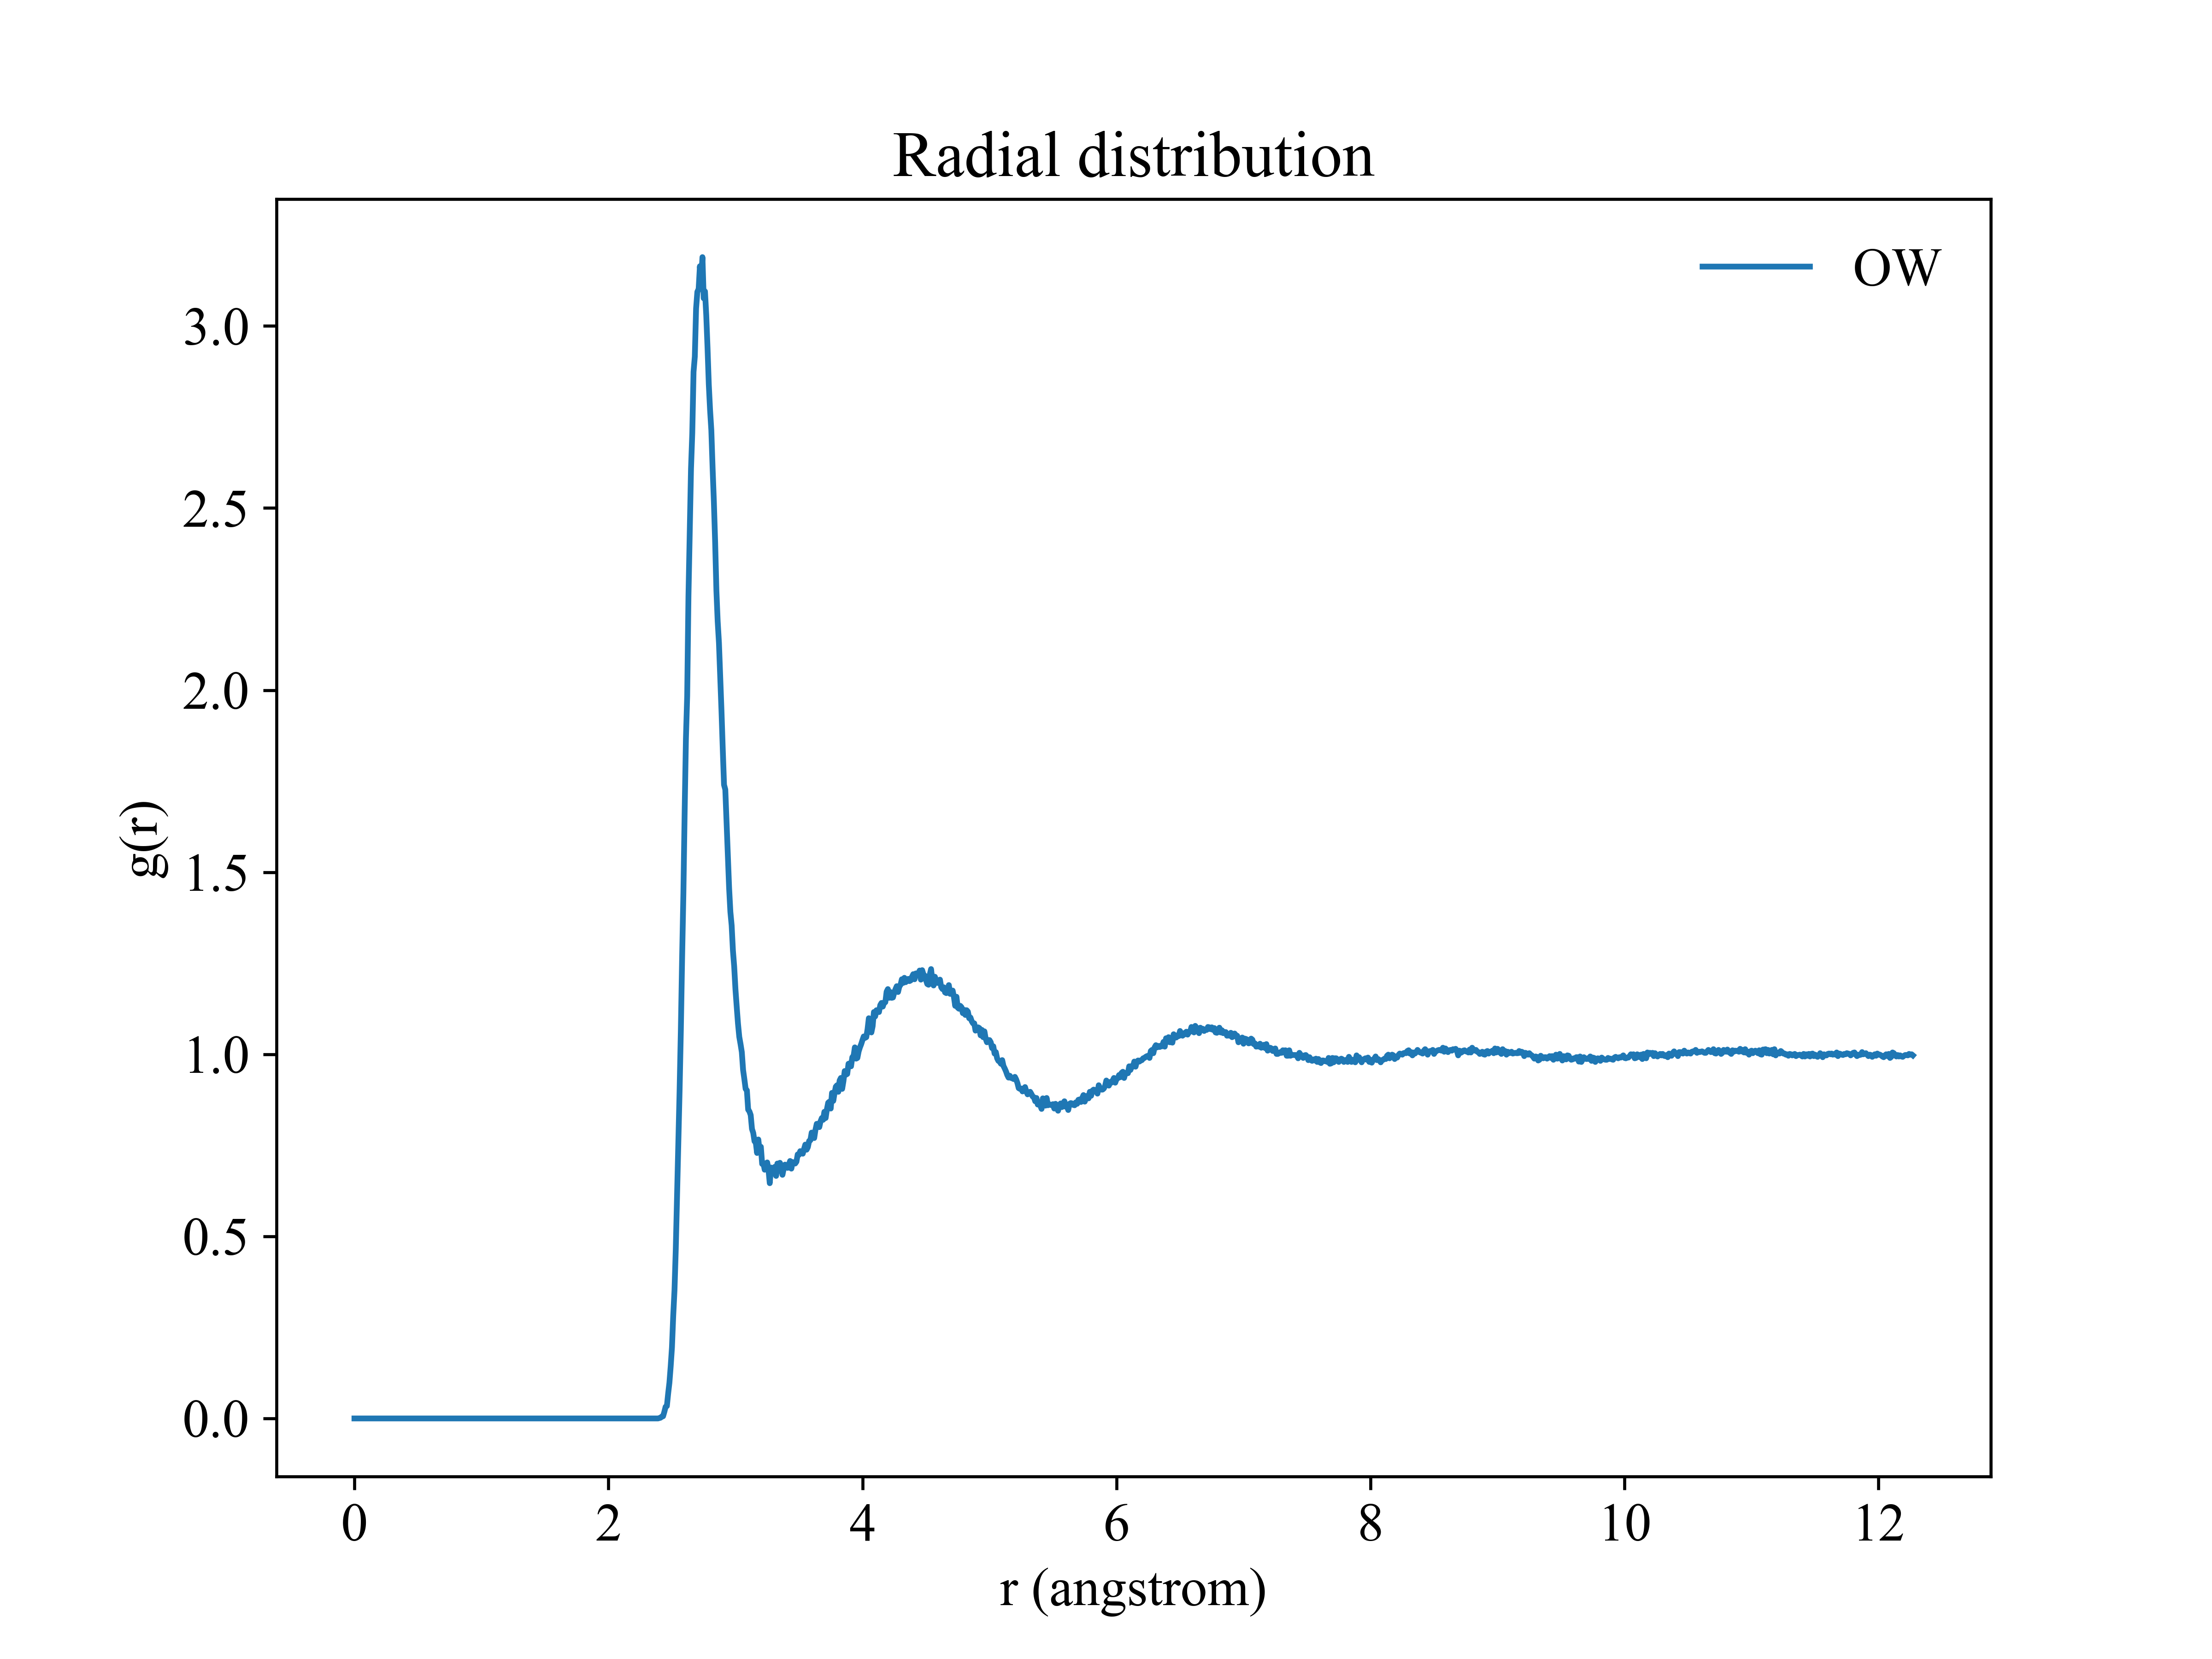
gplt -f rdf.xvg -ux angstrom
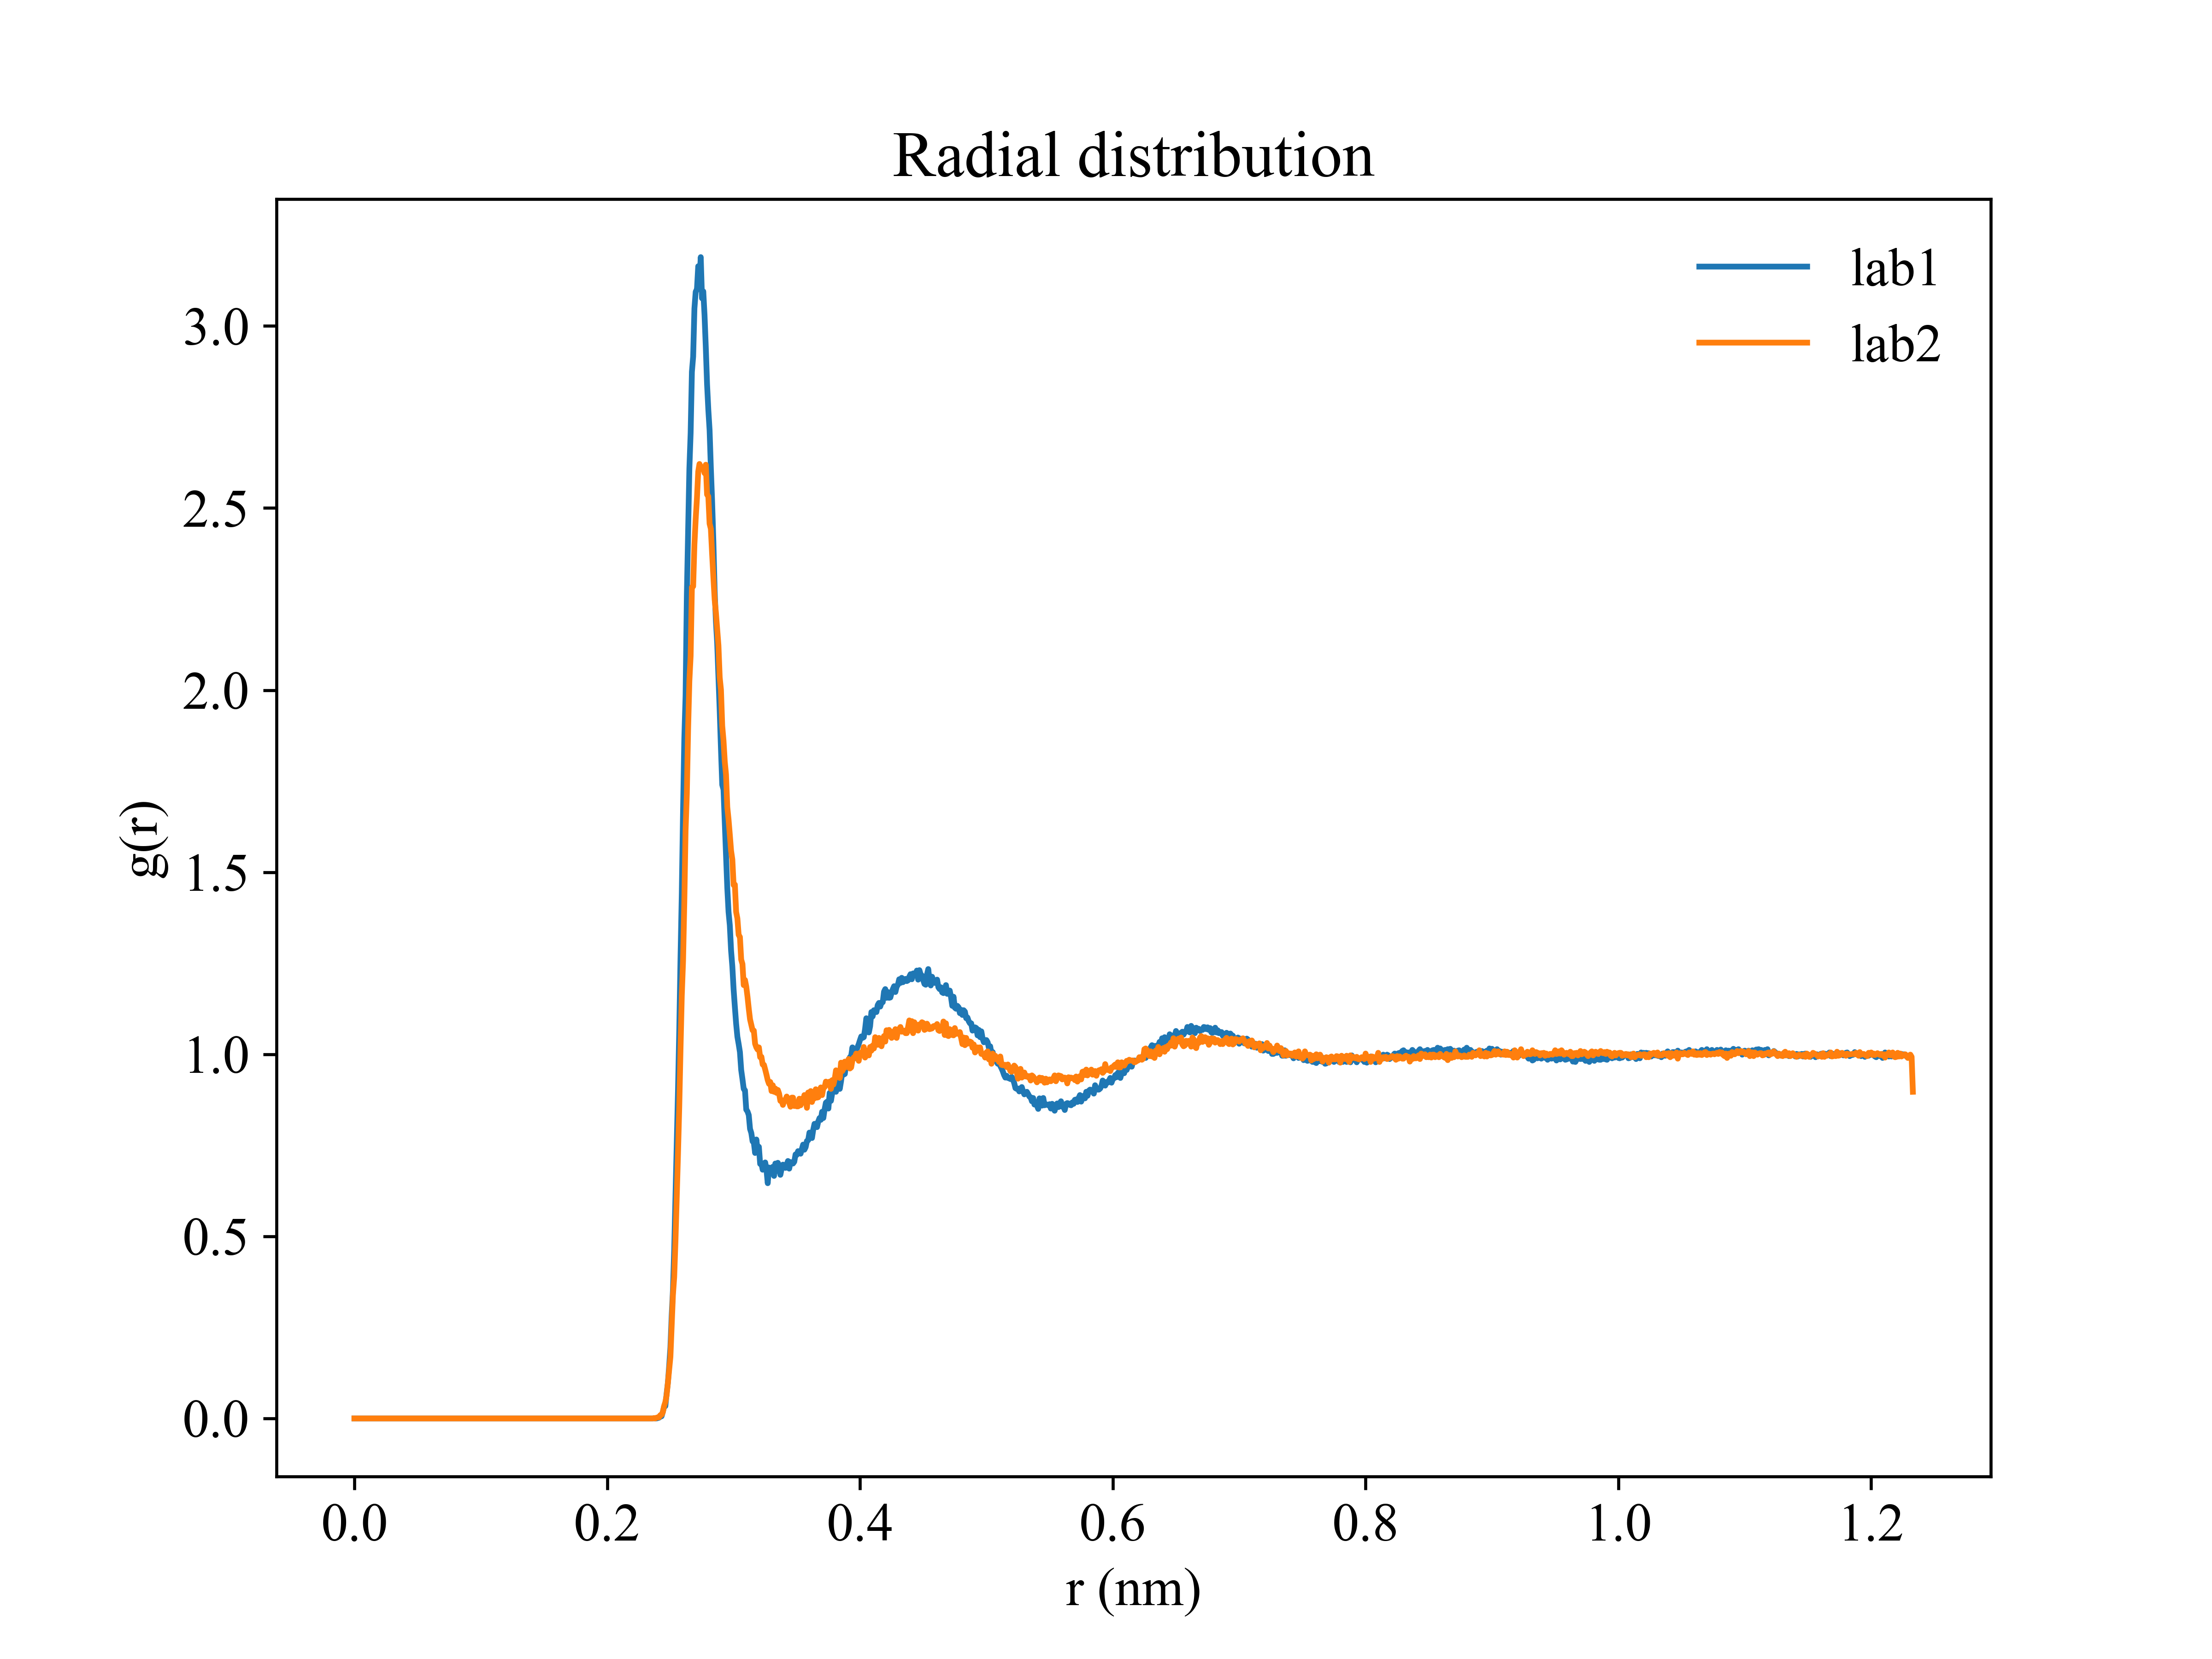
Of course support multi-figures:
gplt -f rdf1.xvg rdf2.xvg -legend lab1 lab2
Plot xpm
Free Energy Landscape
gplt -f gibbs.xpm
gplt -f gibbs.xpm -d3
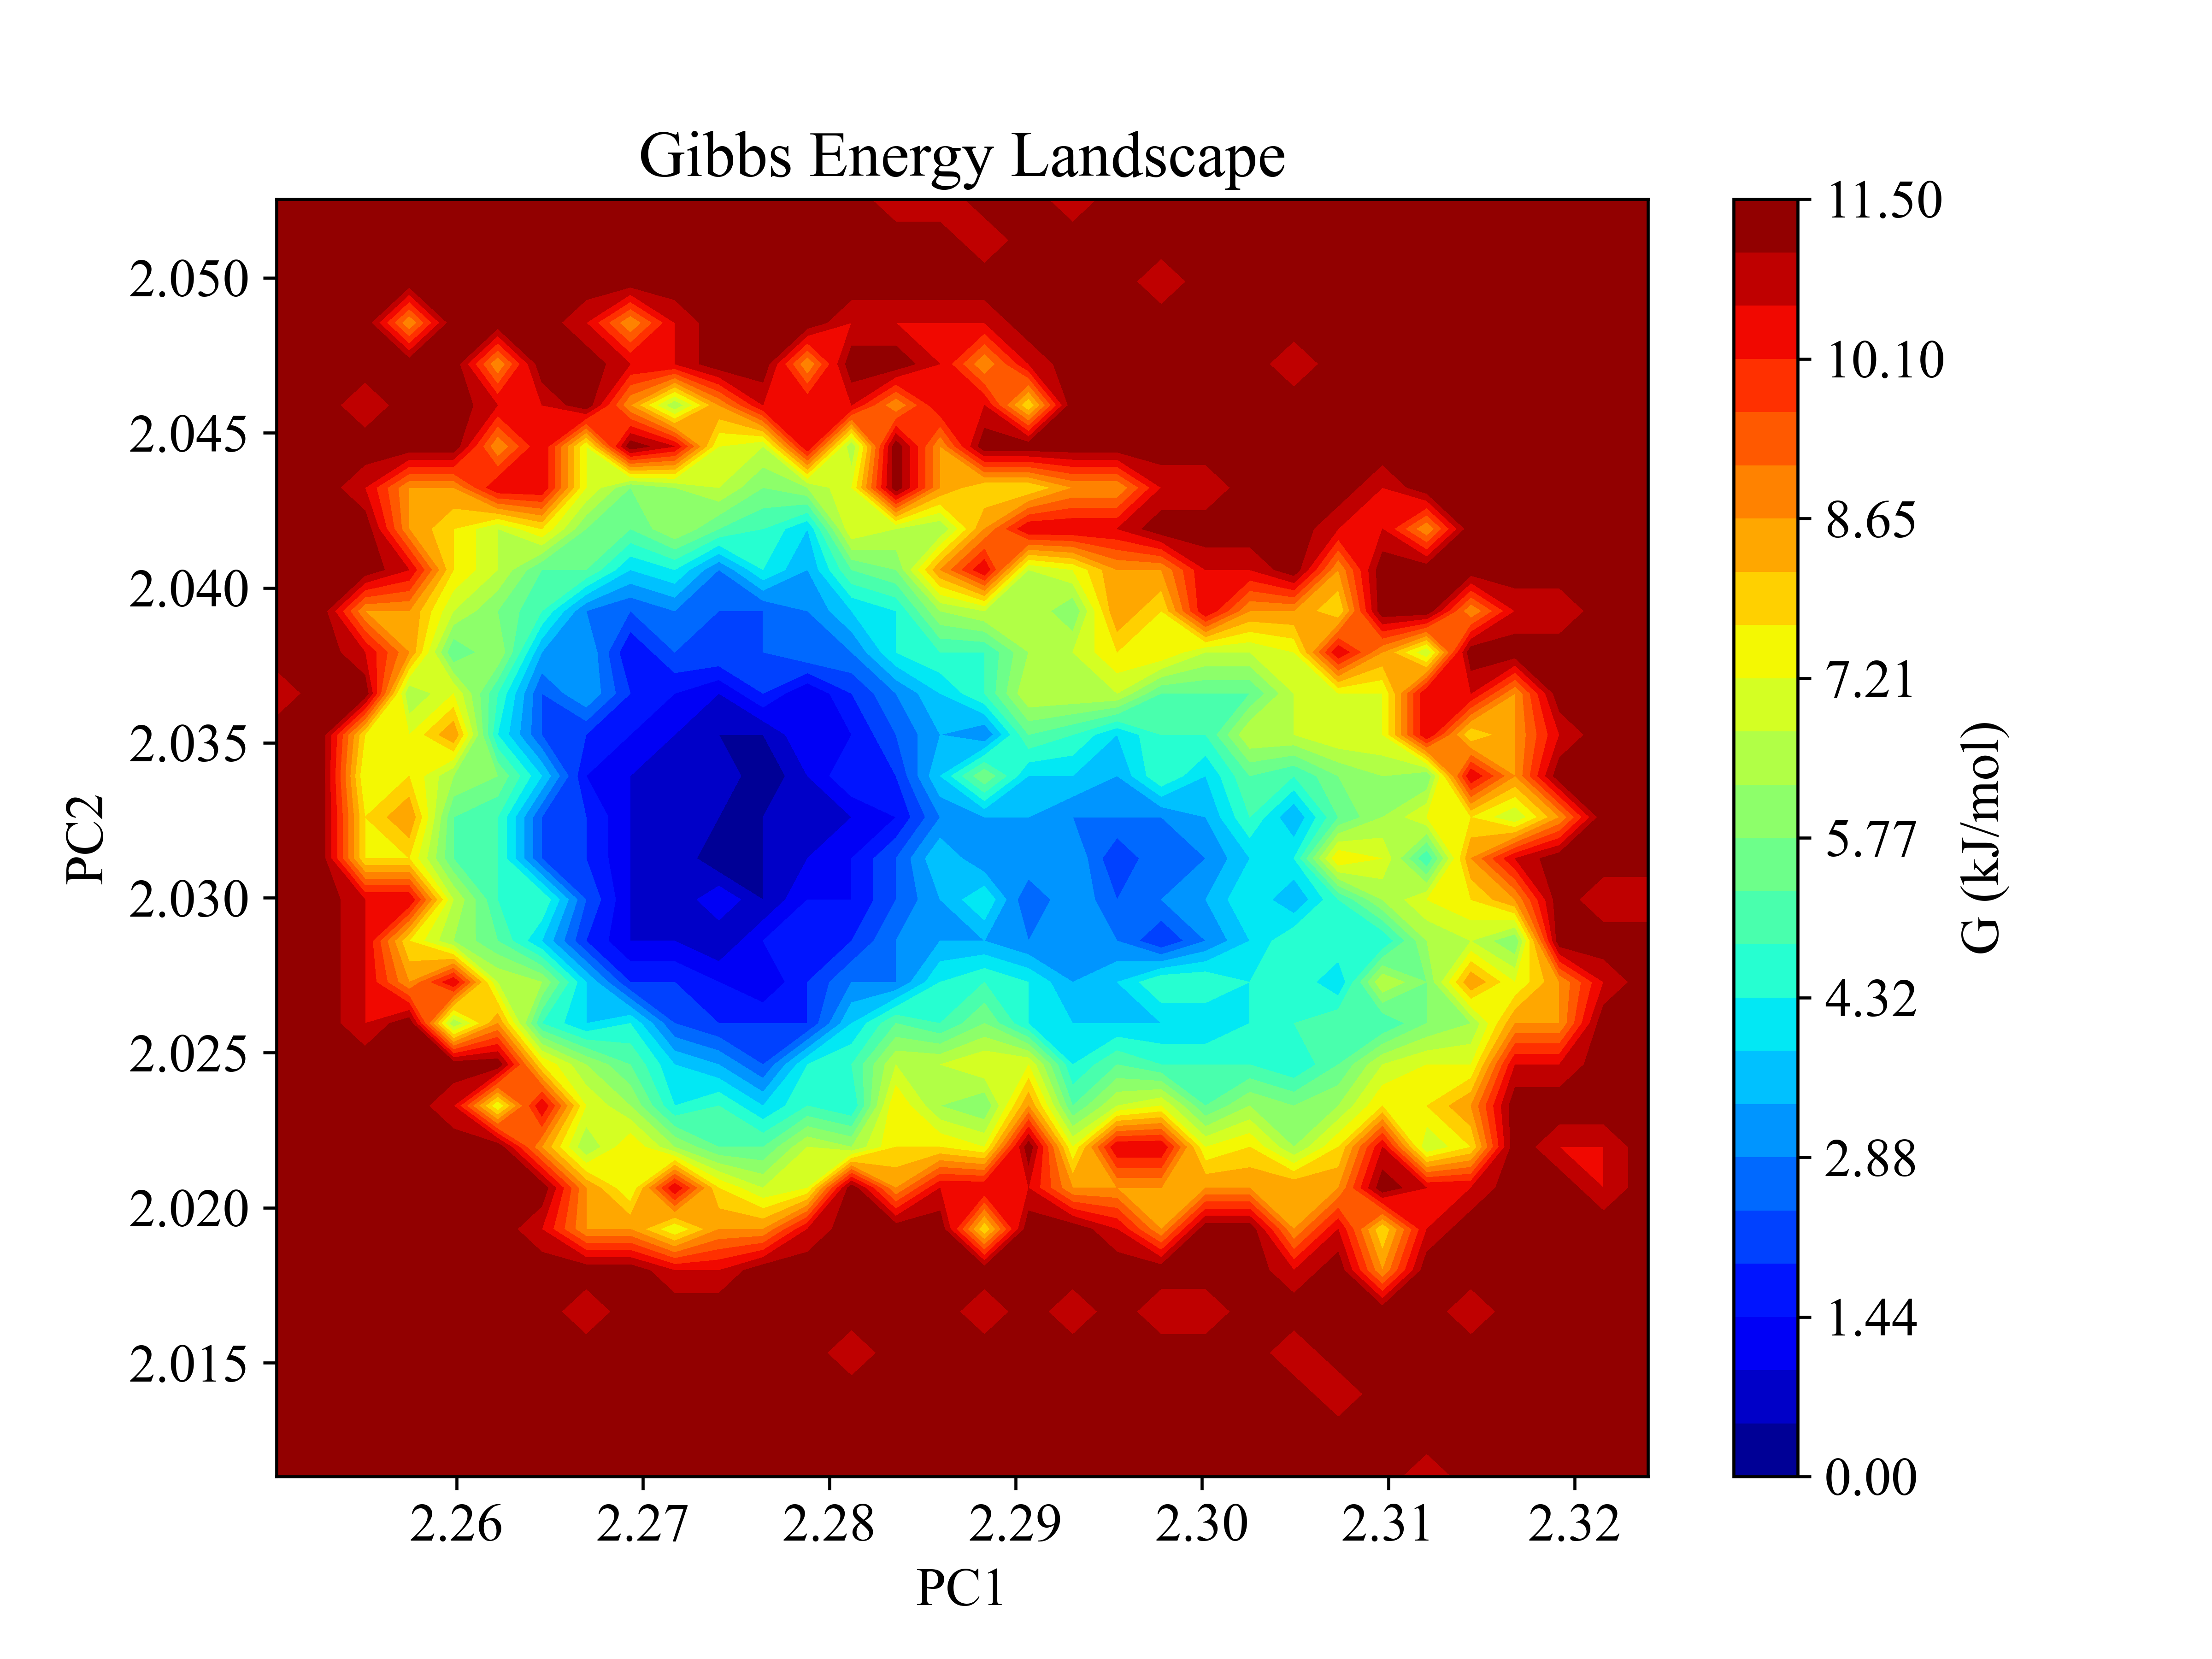
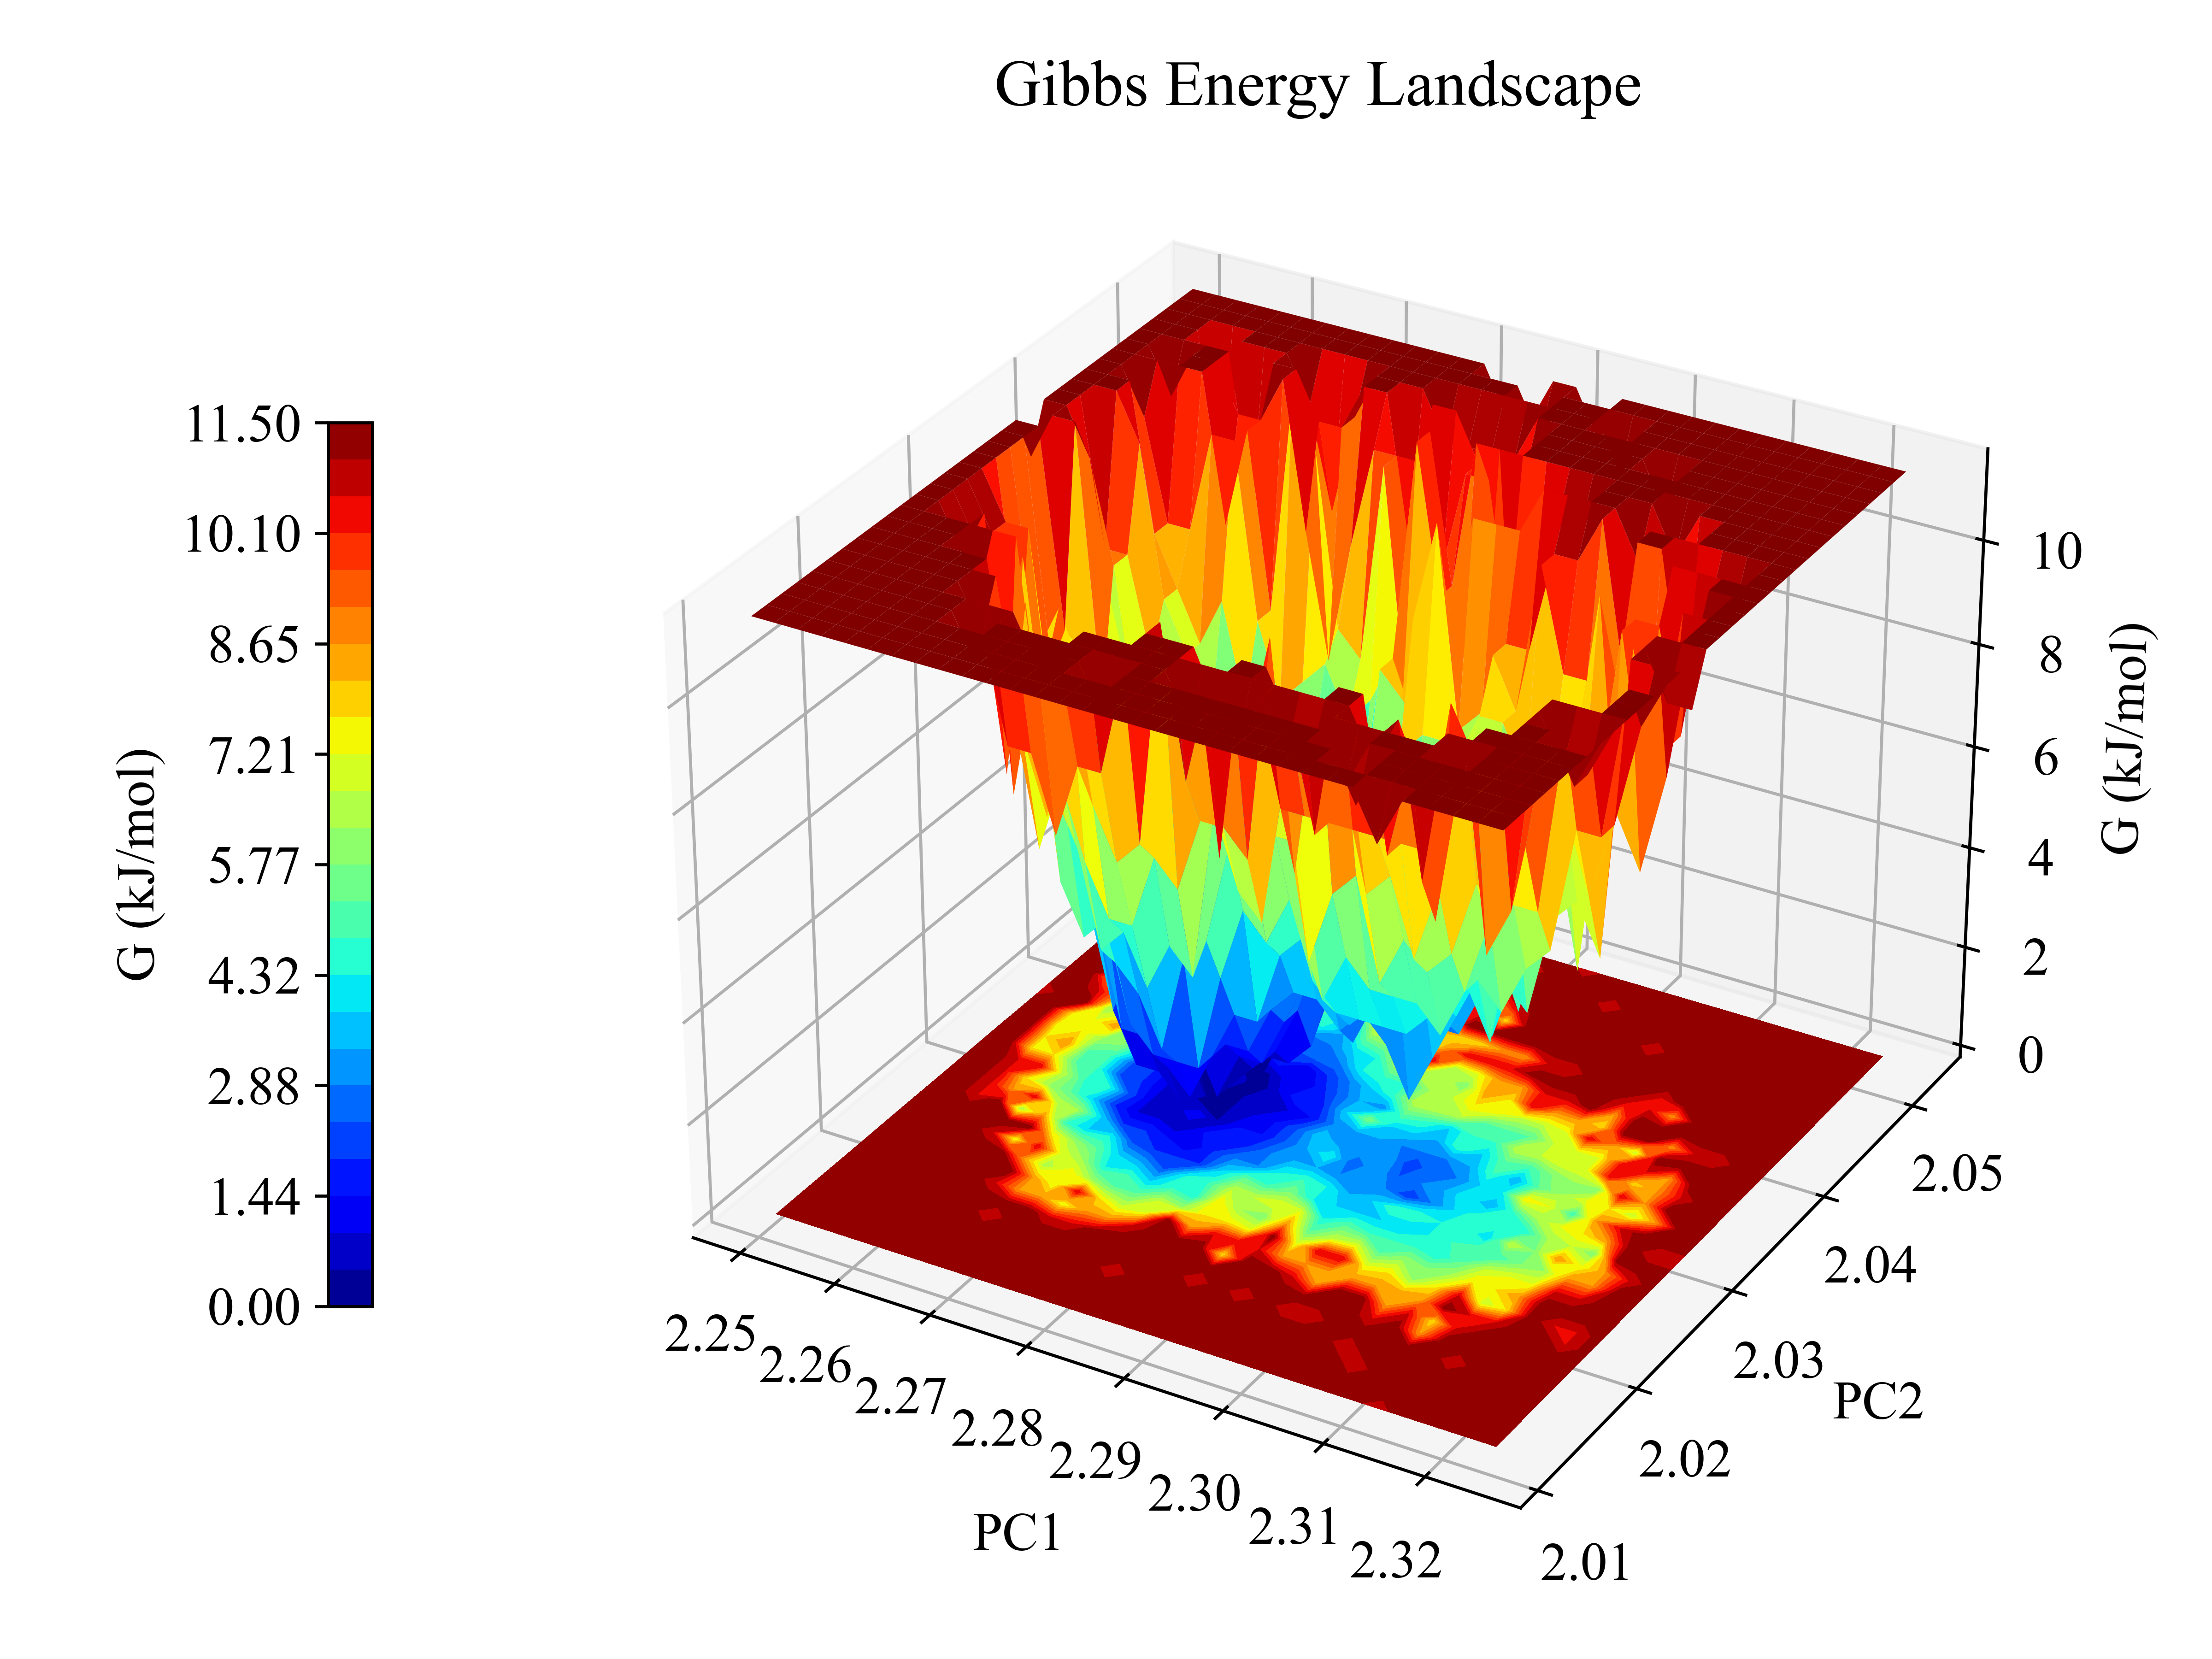
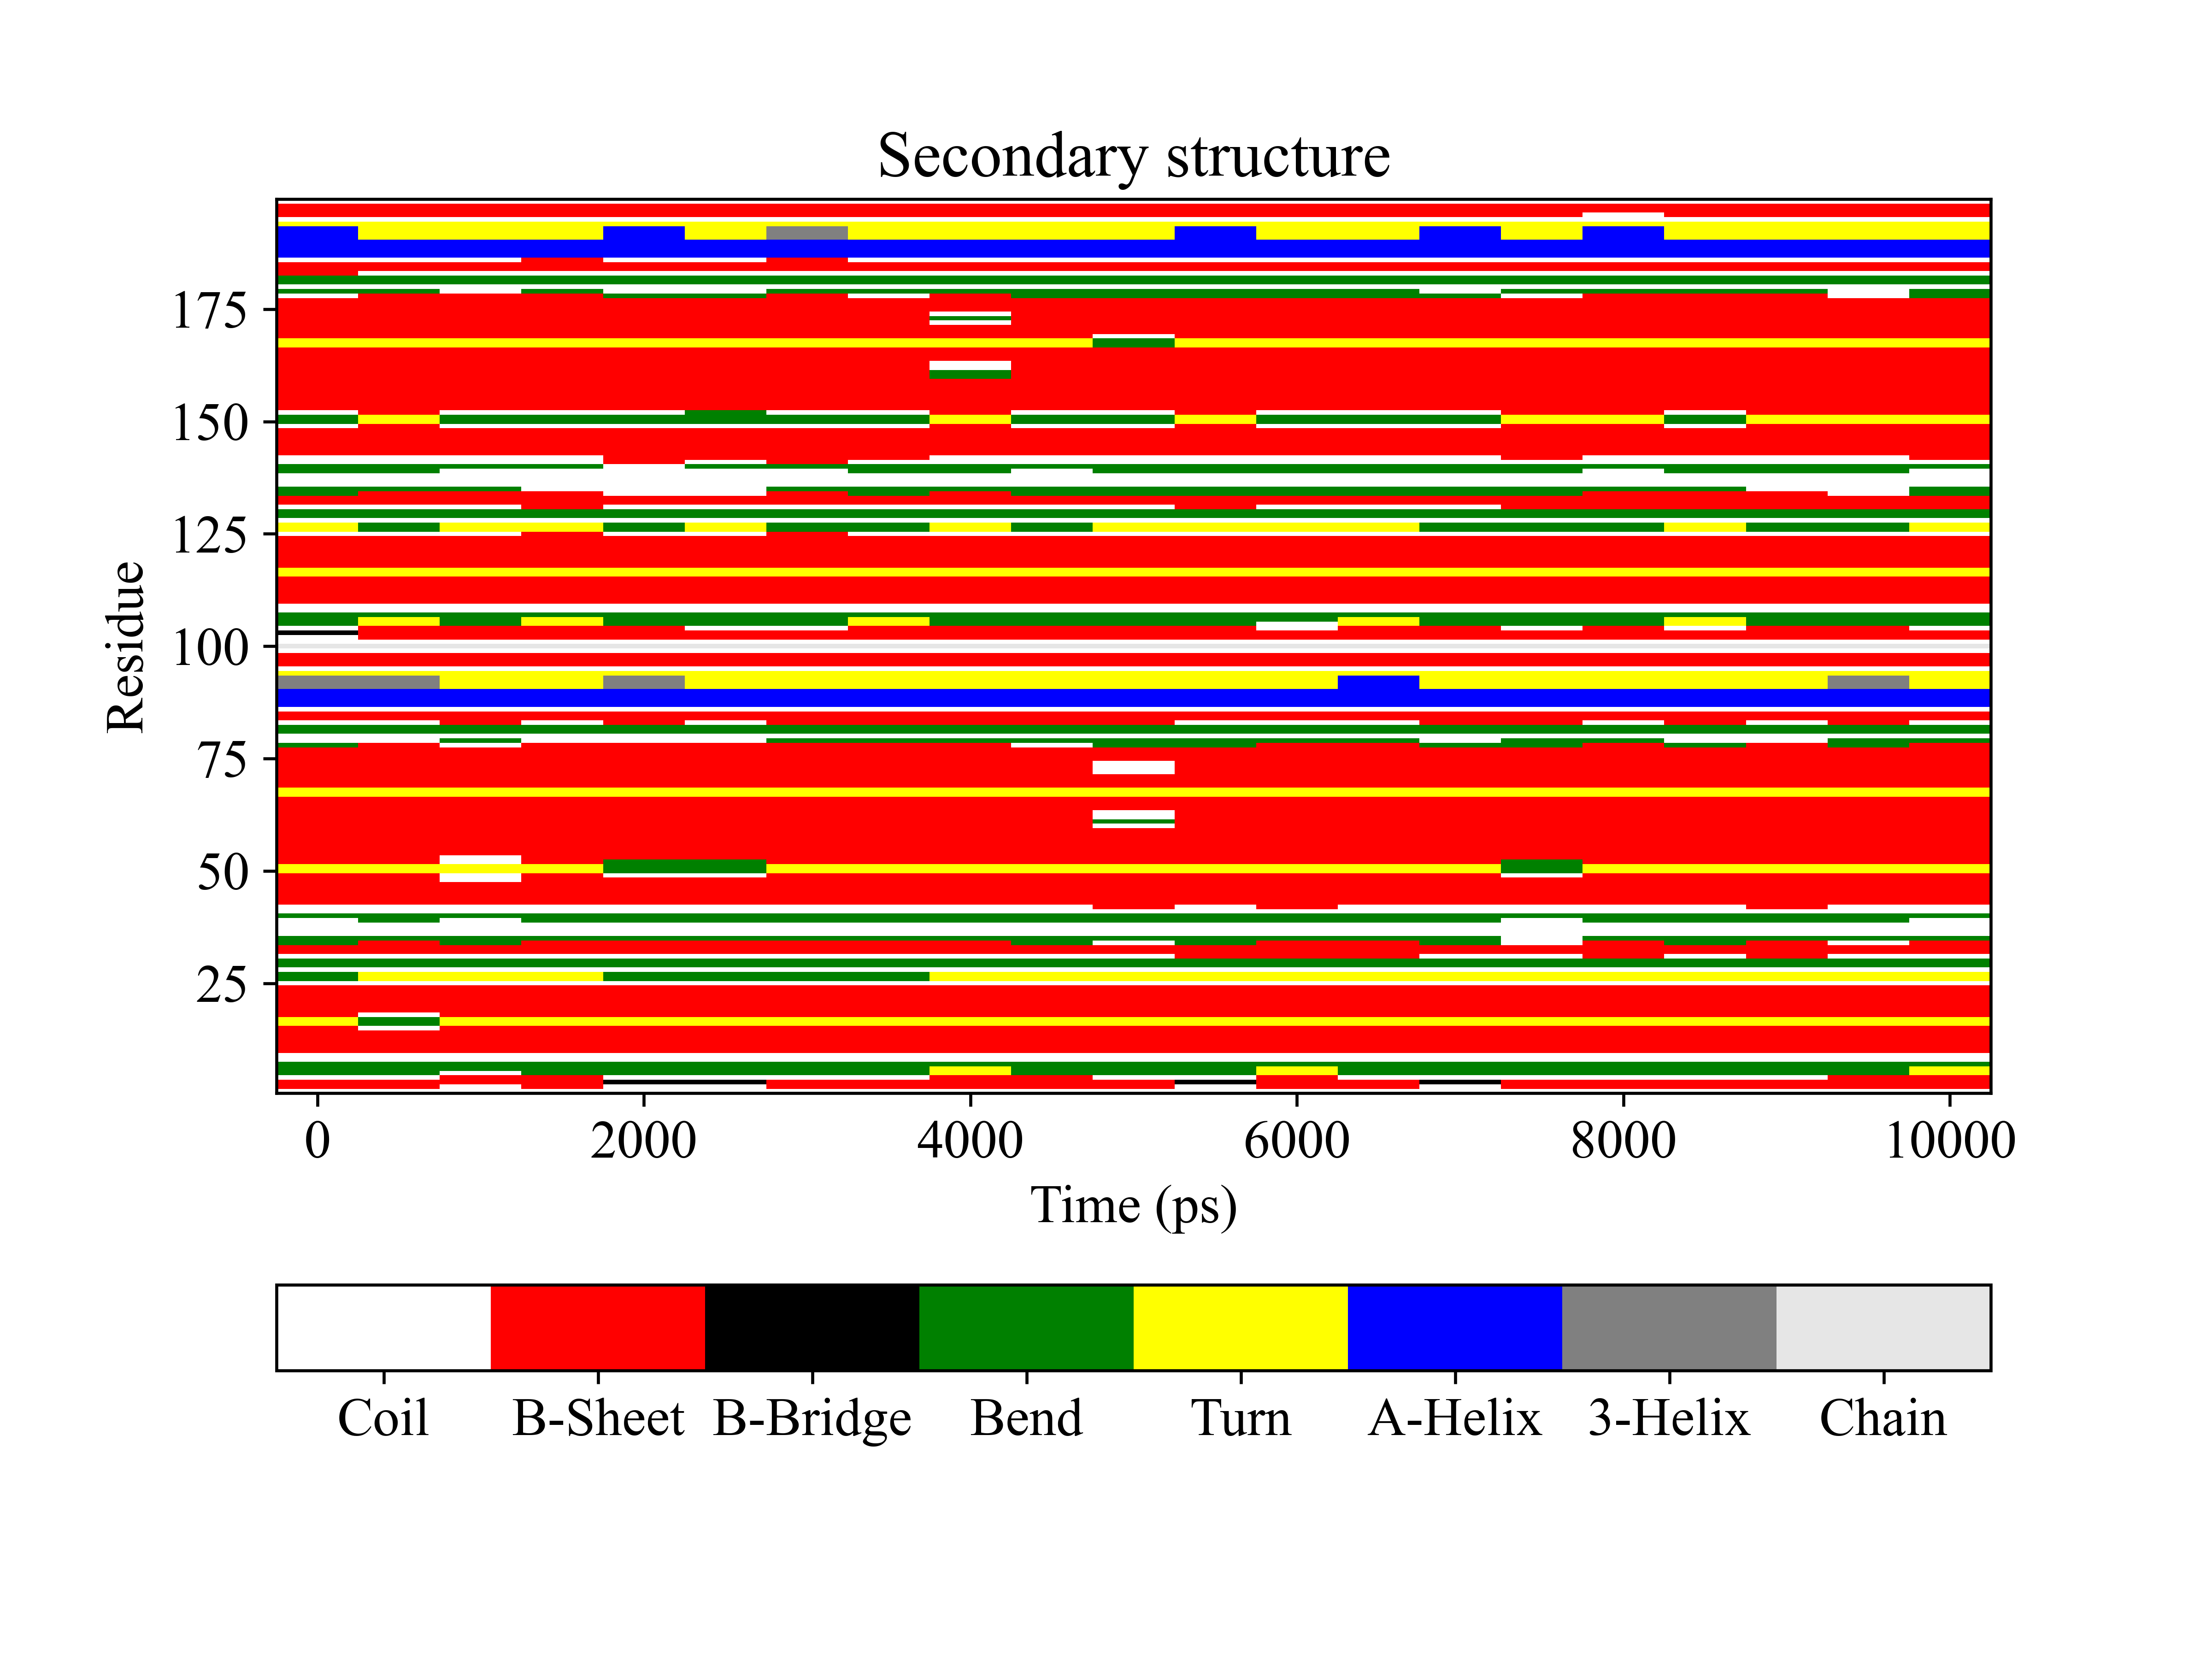
Protein Structure
gplt -f ss.xpm
Hydrogen Bonds
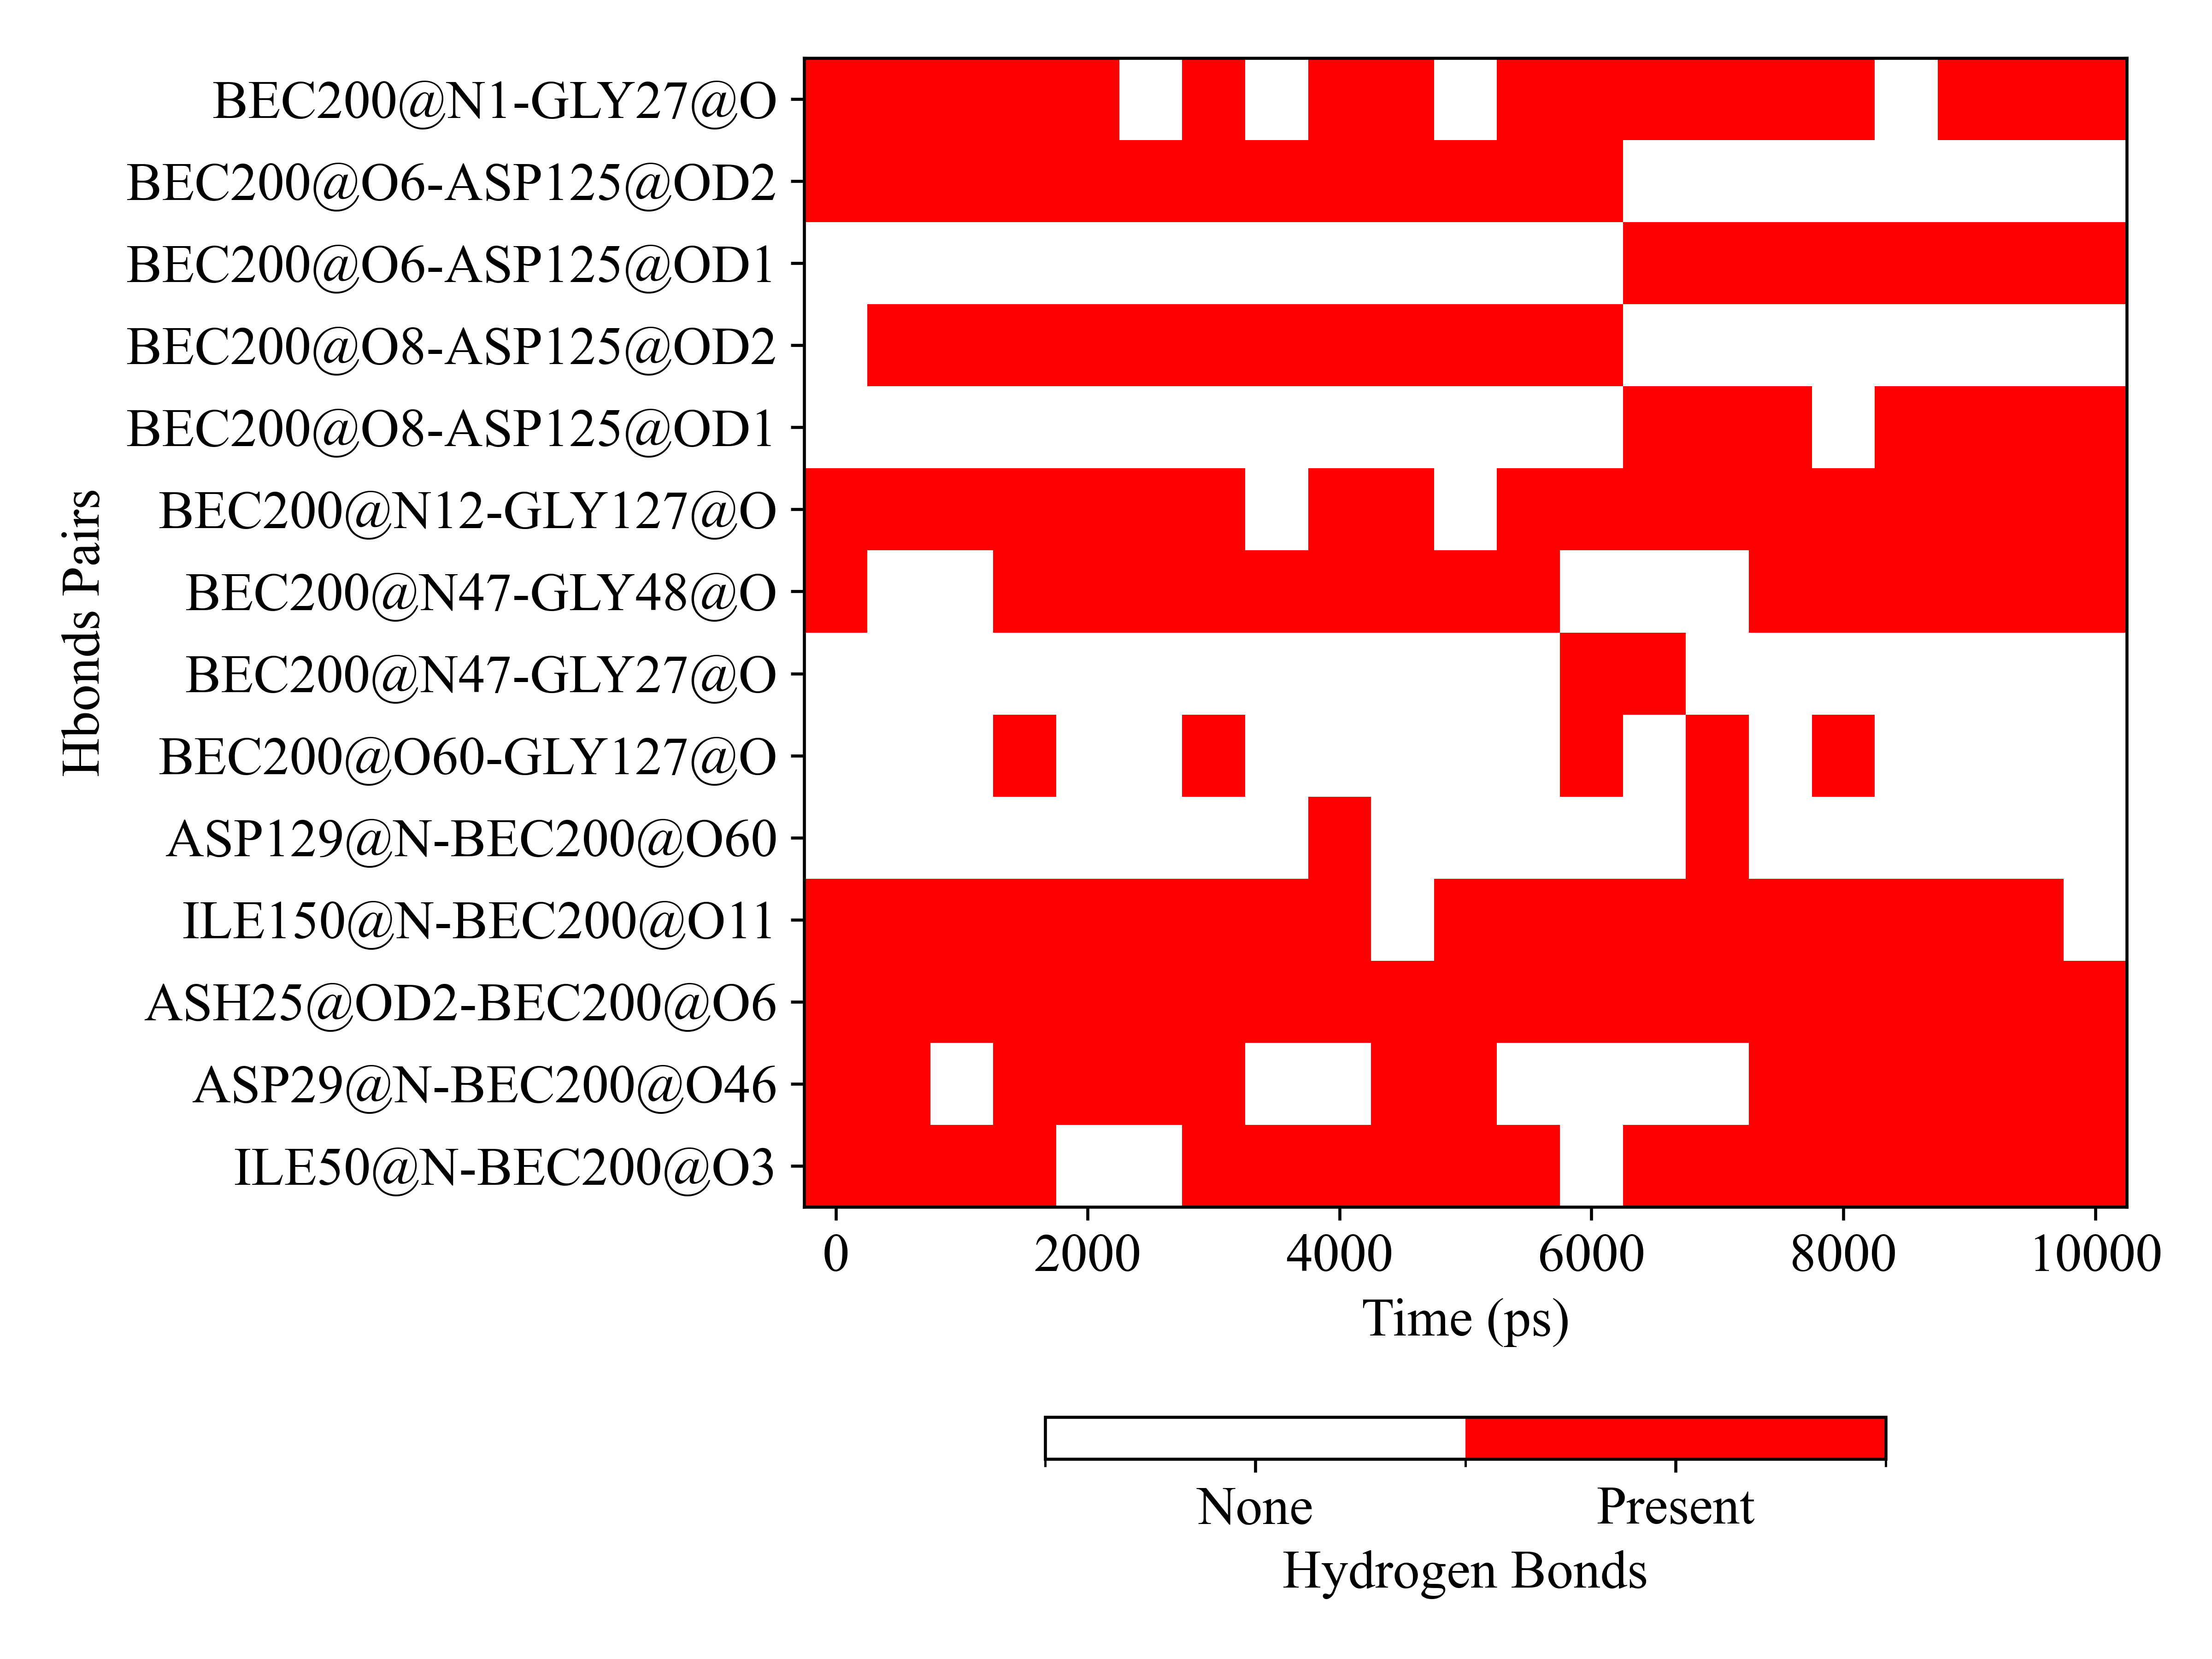
If you provide three files: hbond.ndx and hbmap.xpm generated by gmx hbond and system .gro , the program can use Donor-Acceptor label (resname+resid@atomname) to replace yticks.
Note
The ndx file name must be placed before the gro/xpm file
gplt -f hbond.ndx 1EBZ.gro hbmap.xpm -yaxis 'Hbonds Pairs' -title ''
Note
You can change some plotting style by Matplotlib style. Write a plain text file style.mplstyle:
axes.labelsize:     8
axes.linewidth:     1
xtick.labelsize:    8
ytick.labelsize:    8
ytick.left:         True
ytick.direction:    in
xtick.bottom:       True
xtick.direction:    in
lines.linewidth:    1.5
legend.fontsize:    8
legend.loc:         best
font.family:        Times New Roman
font.size:          8
Then add -style style.mplstyle option to gplt command line
Plot dat
Some plain text with .dat file extension
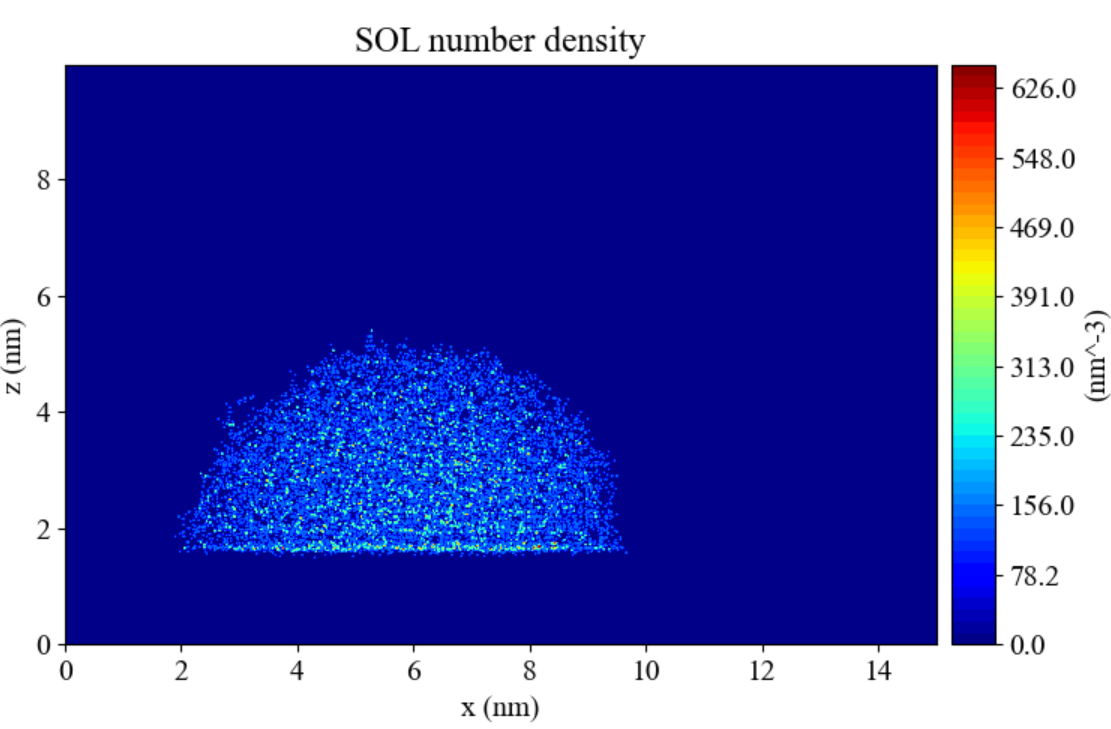
.datfromgmx densmap -od
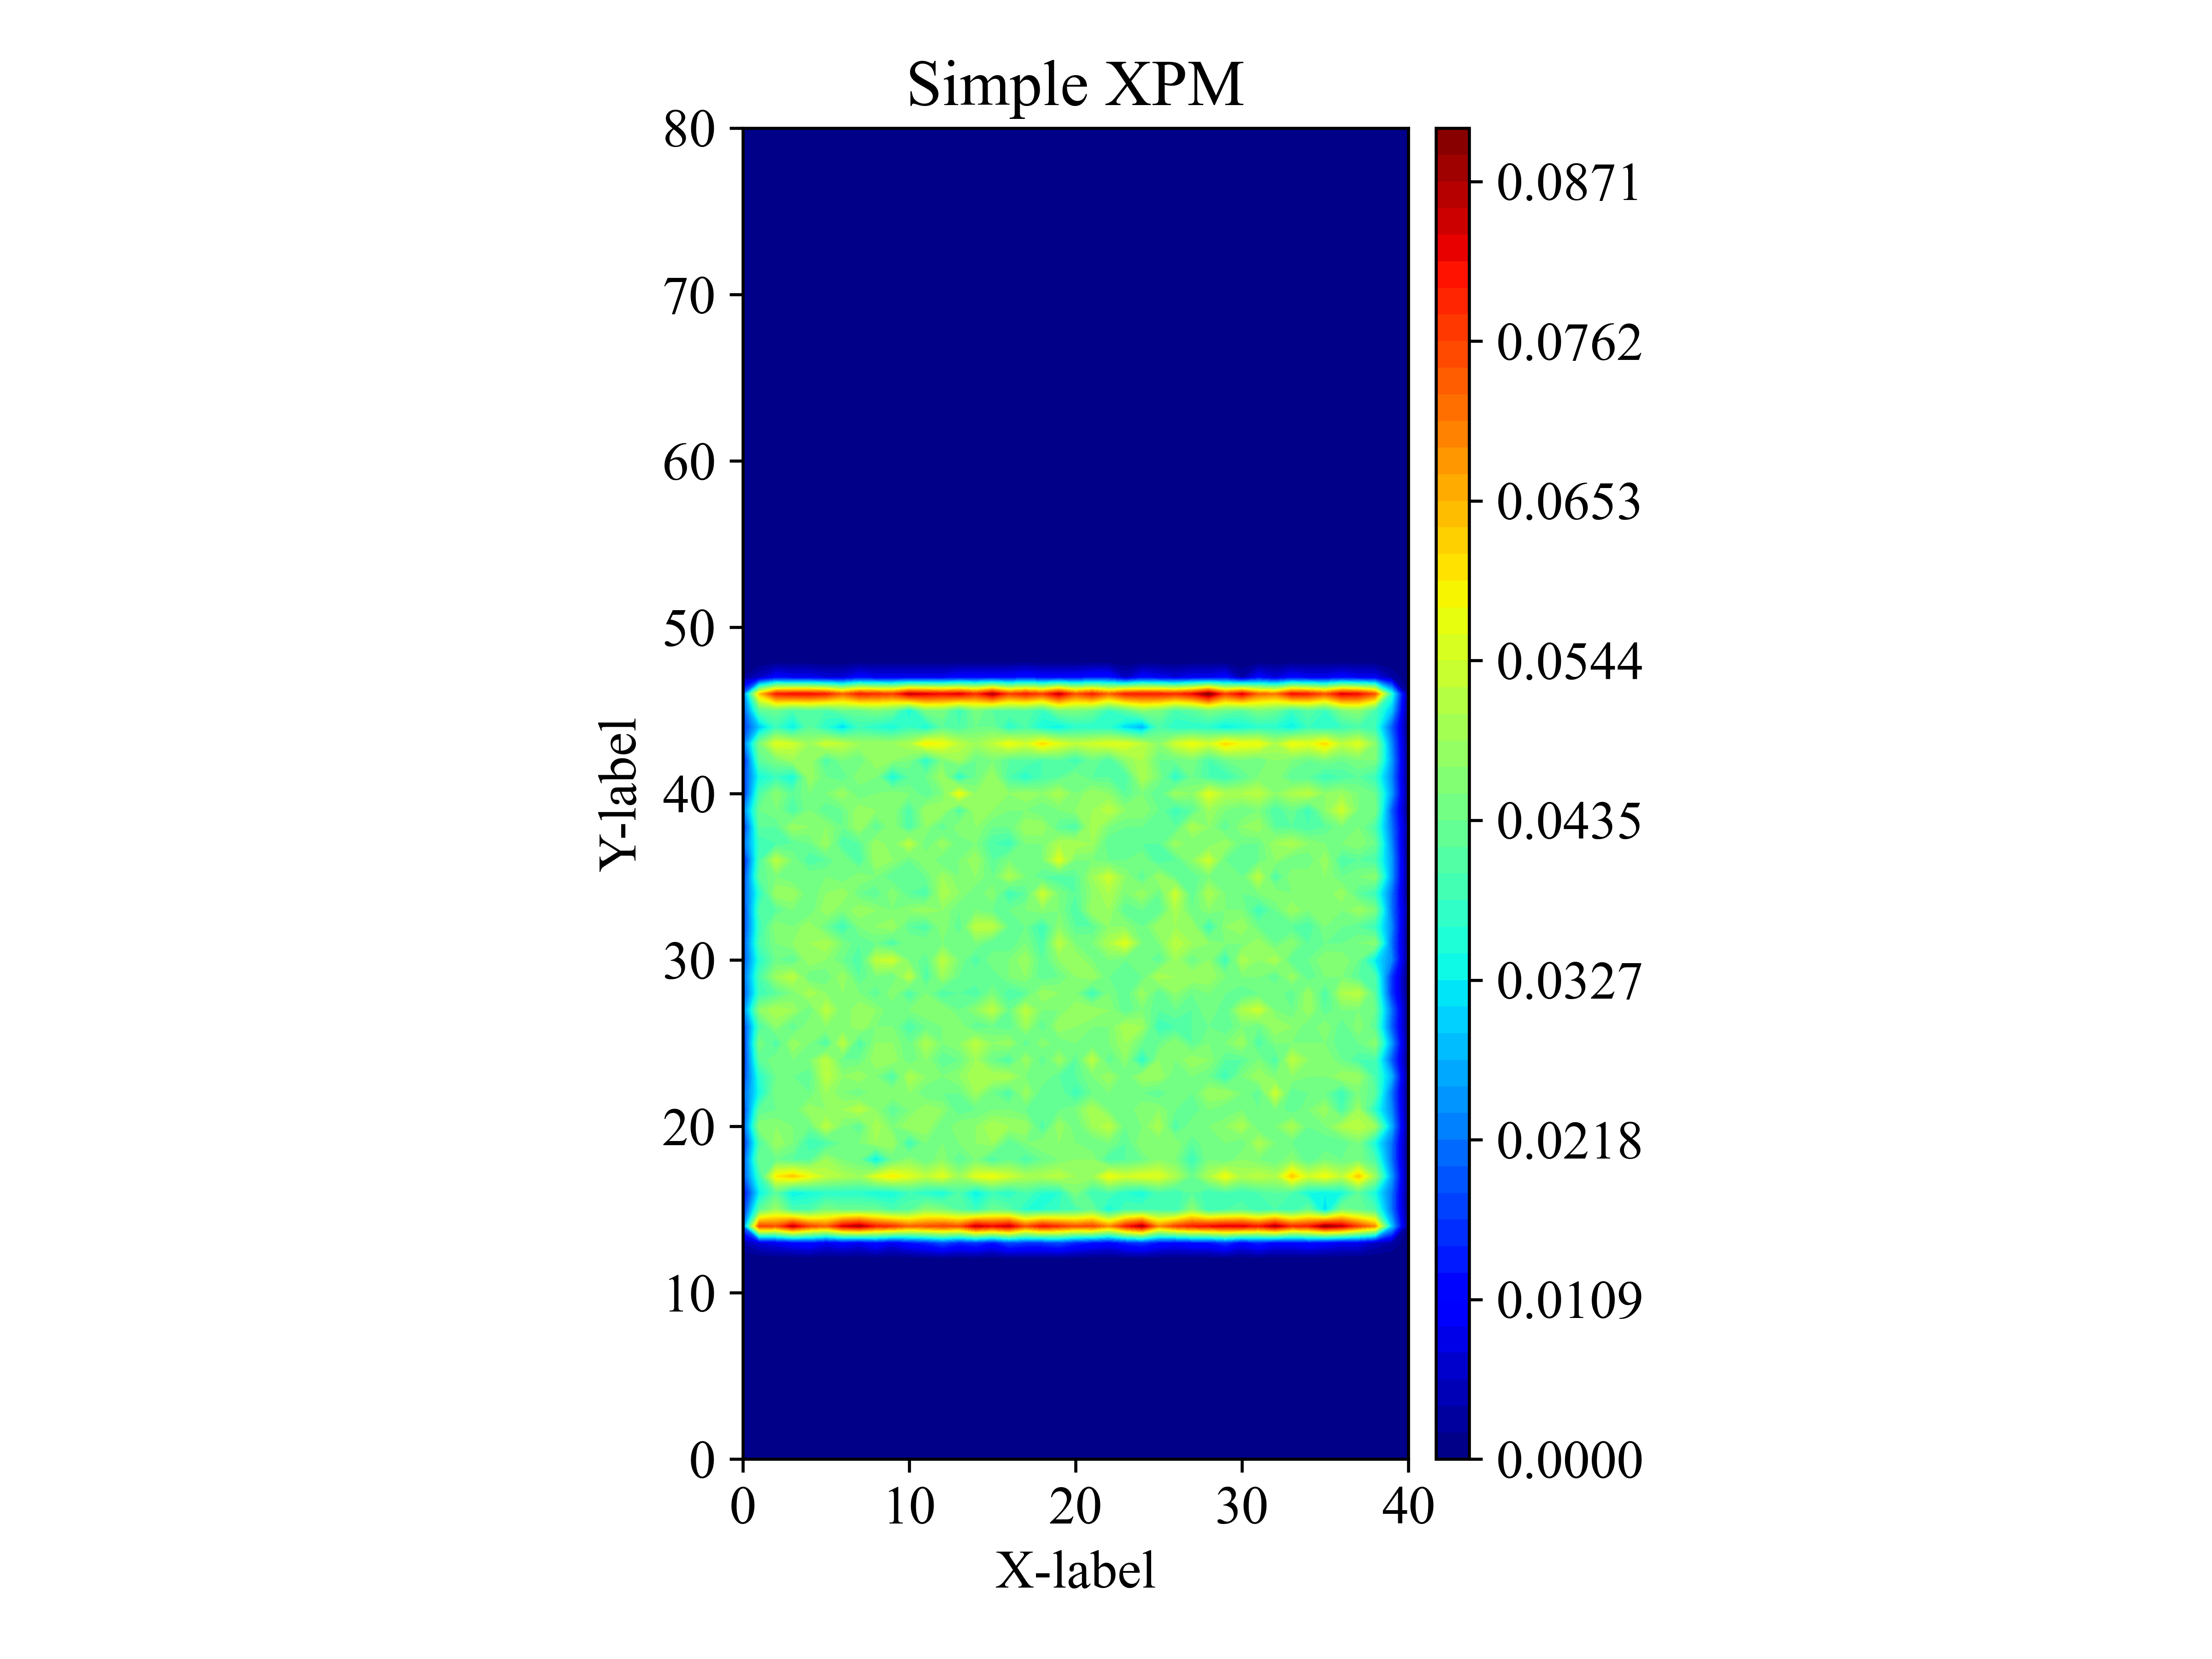
gplt -f densmap.dat && gplt -f densmap.xpm -aspect equal
This command will generate a densmap.xpm file, then you can plot it.
-aspect equal: Use same scaling from data to plot units for x and y
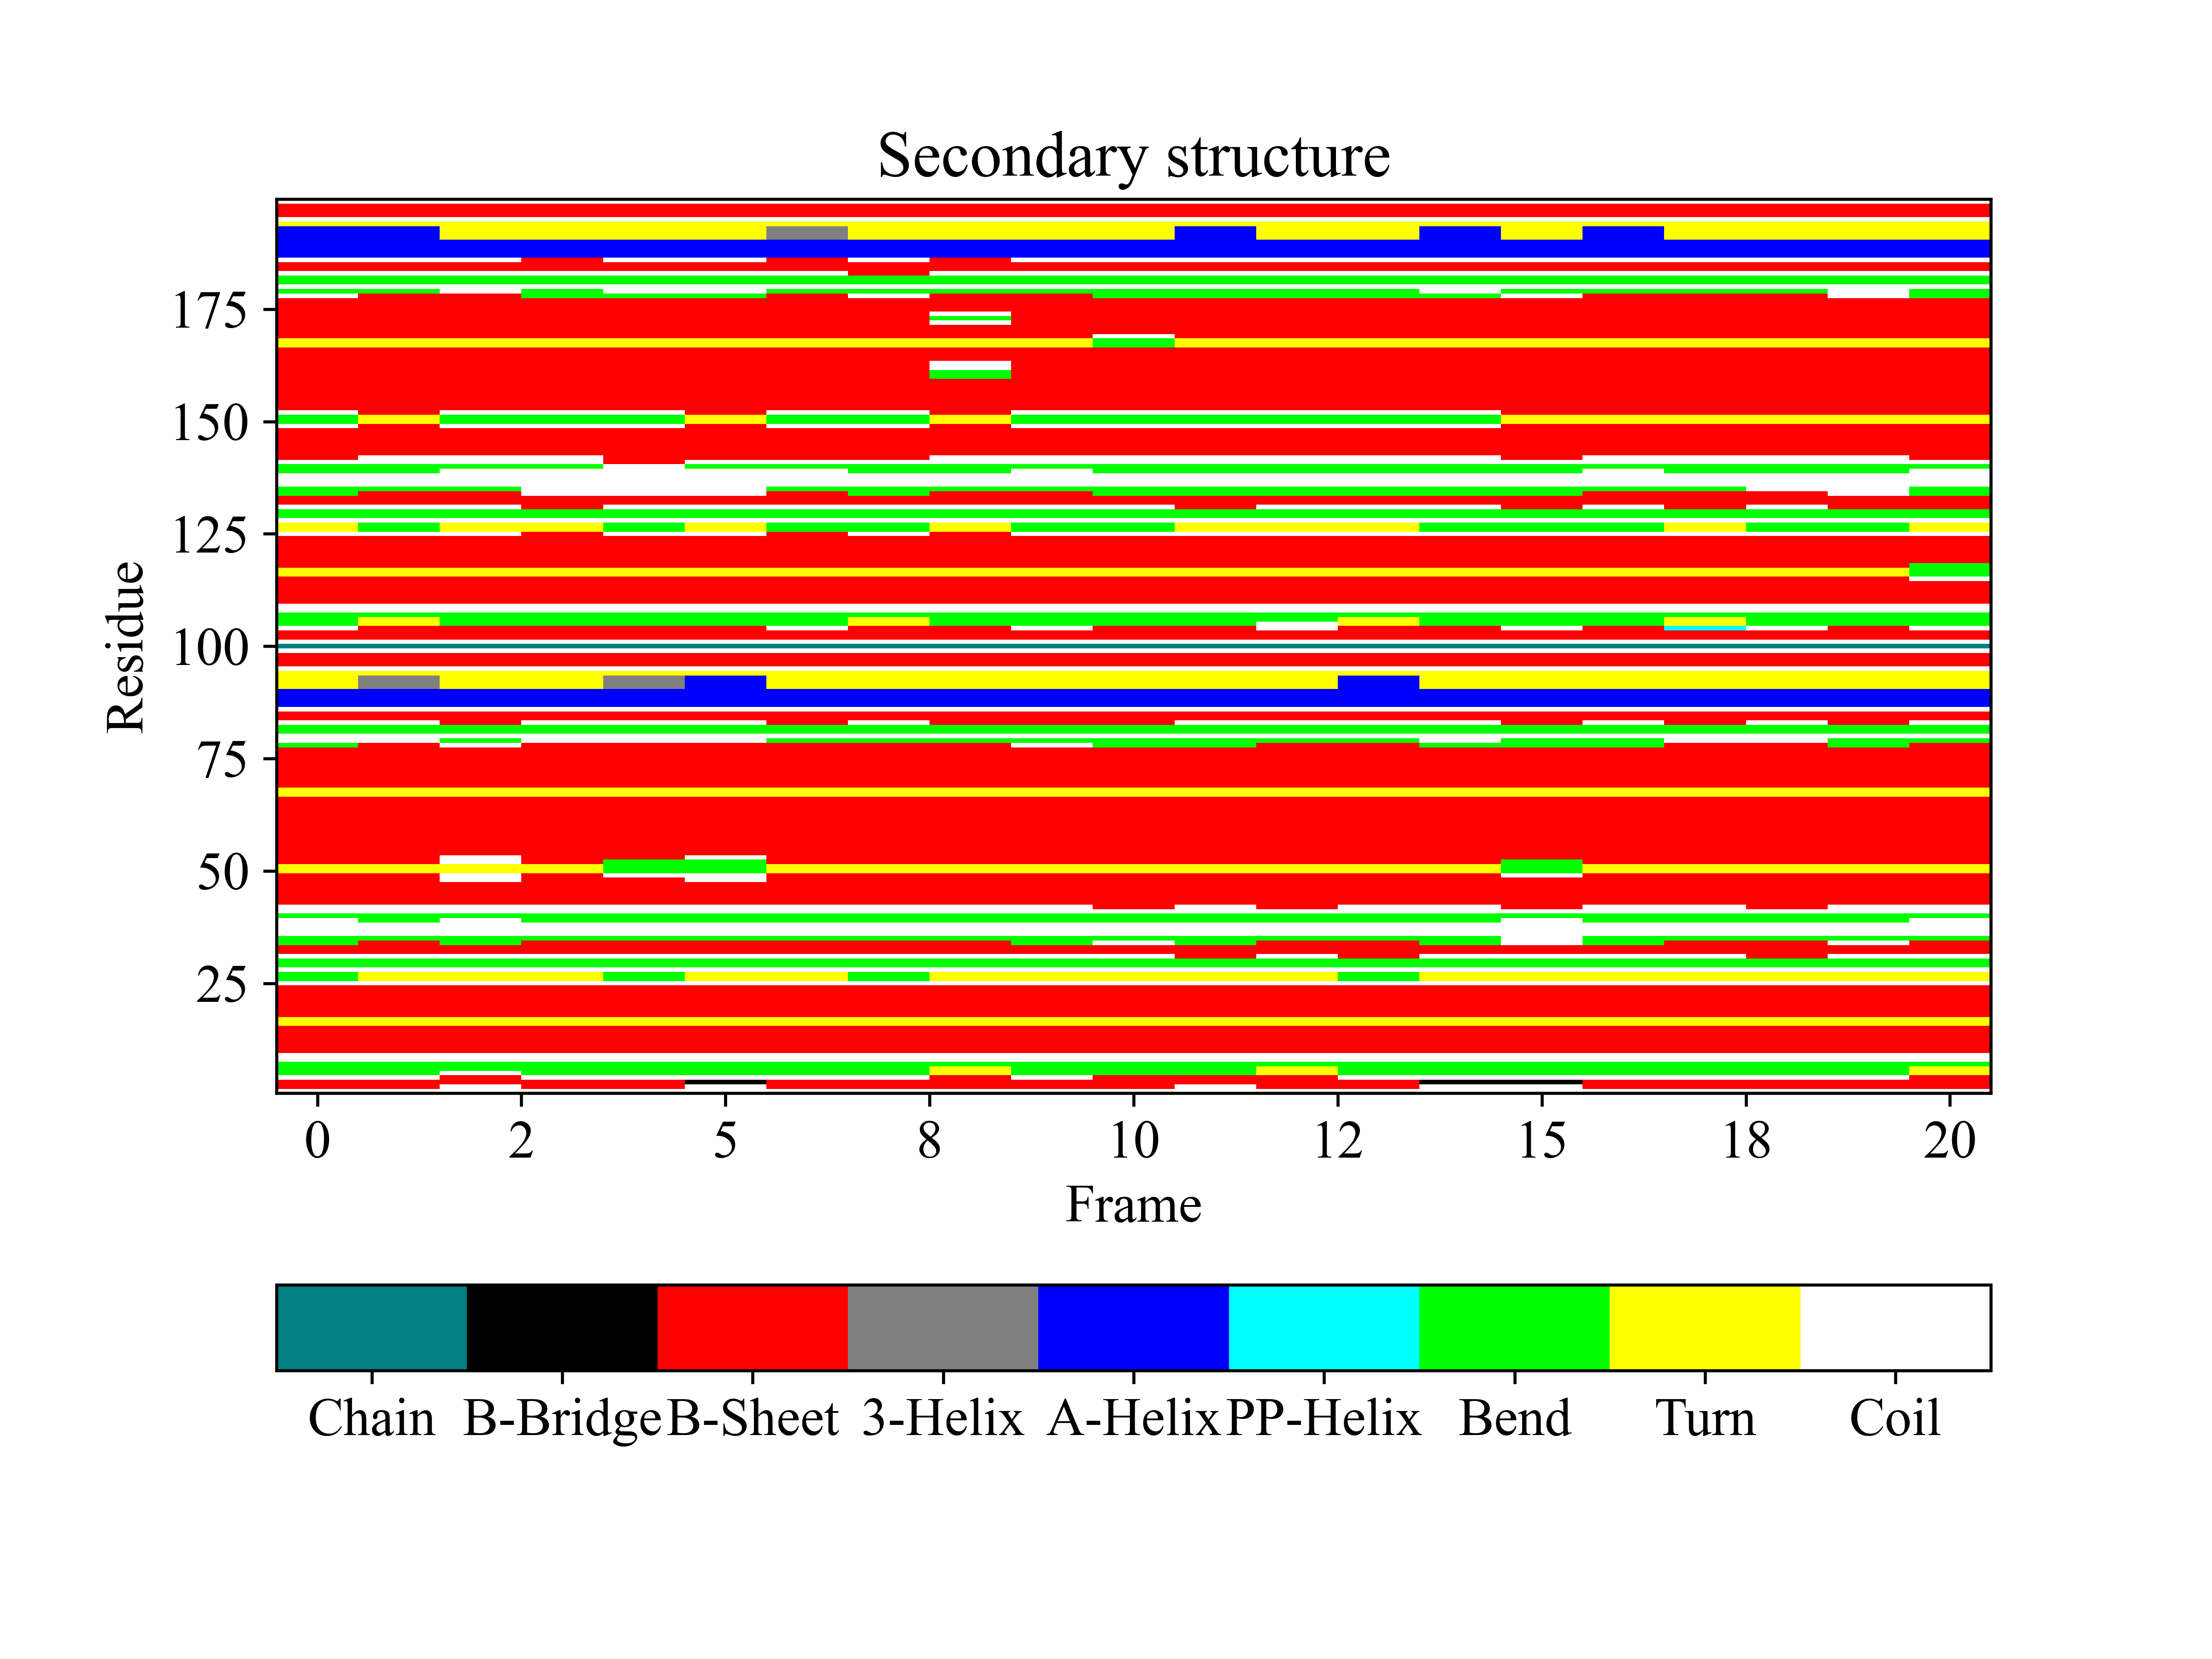
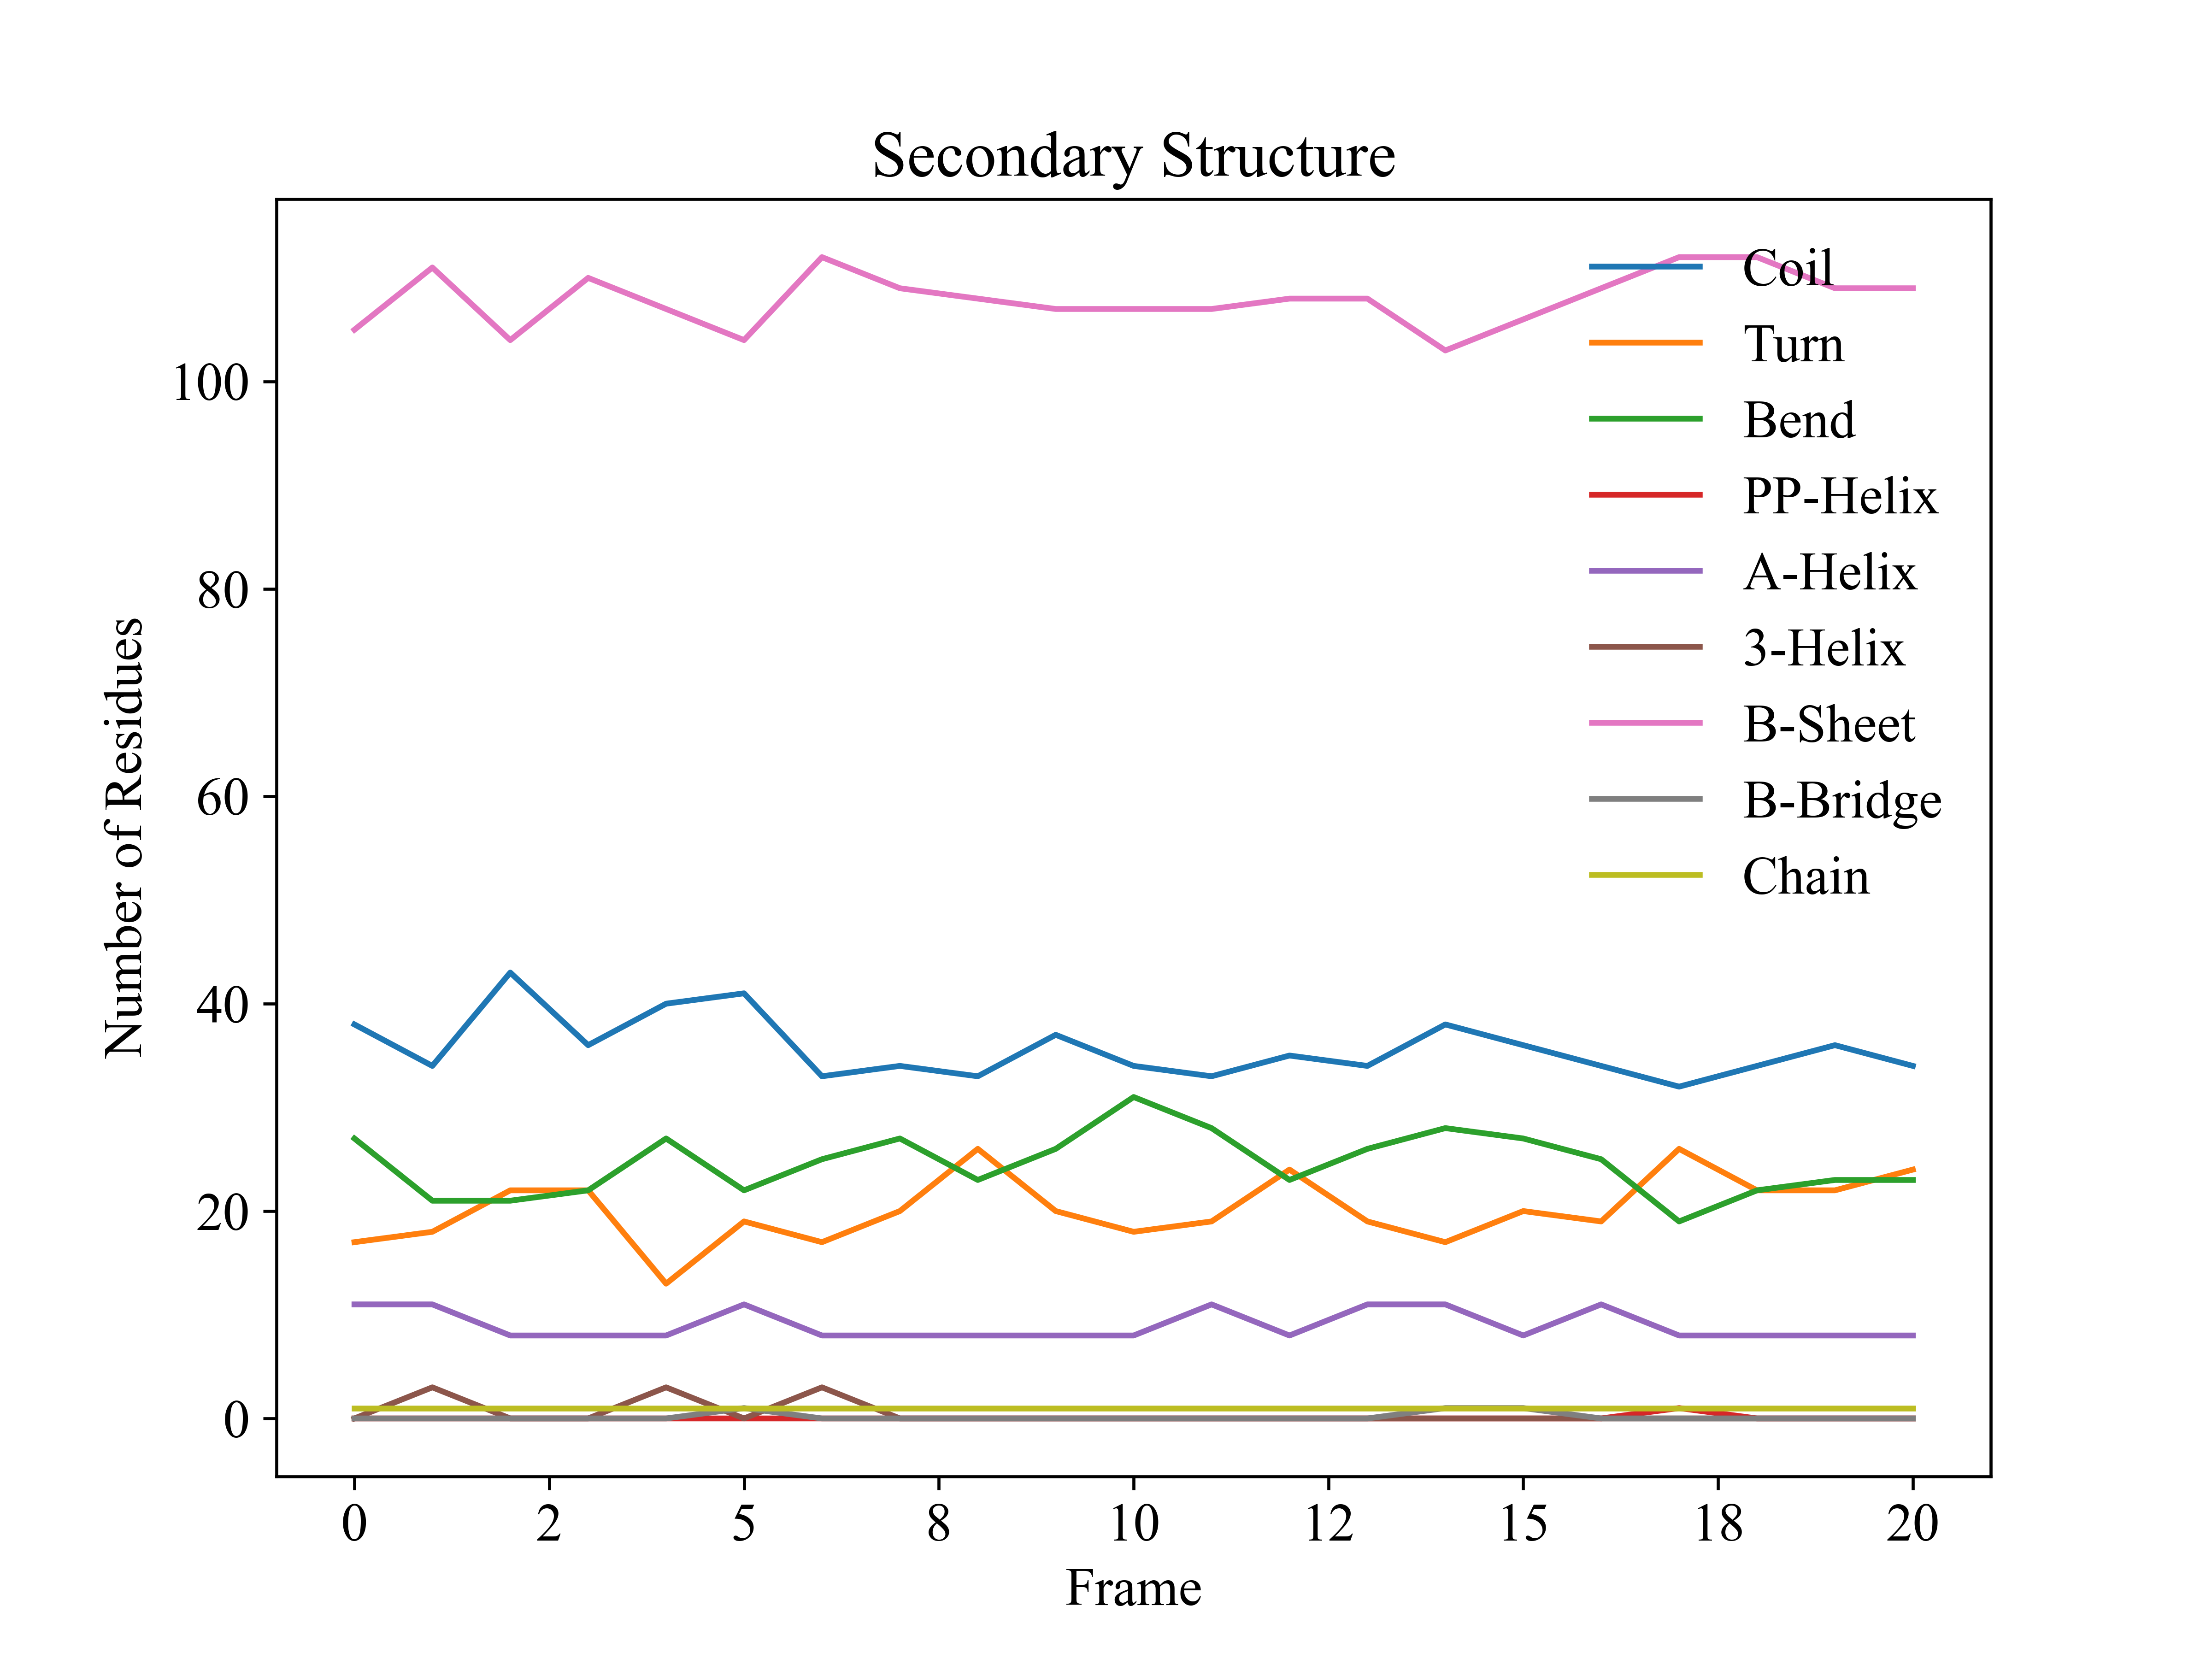
dssp.datfromgmx dssp(gmx >= 2023)gplt -f dssp.dat && gplt -f dssp.xpm -xprec 0 -yprec 0 -o dssp.png && gplt -f scount.xvg -xprec 0 -yprec 0 -o scount.png
.datwith xyz columnsgpltalso supports the file with three columnsxbin ybin zvalue, such as:1 14 0.0771830985915493 4 14 0.0771830985915493 7 14 0.0876056338028169 4 16 0.03492957746478873 6 13 0.011830985915492958 9 14 0.07887323943661971 16 14 0.08647887323943662 12 17 0.05718309859154929 13 14 0.07549295774647888
x and y of grid point must be integer.
gplt -f xyz.dat && gplt -f xyz.xpm -aspect equal